This week’s Strongerhead Weekly Financial Market Analysis report came a day late as I was not in town the last couple of days. Went to Phuket for a short getaway with my wife as her “honeymoon”. I under estimated the ultraviolet (UV) radiation emitted from the sun while I was at Phuket, and turned into a red lobster as a result of the lack of protection. This reminds me of the need for protection, especially in the market. And thankfully before I board the plane to Phuket, I closed off my losing position on DUST (an inverse ETF for Gold). On Friday, it gaped down big time (by $31). Imagine the damage from unprotected trading can do to your capital? Thus, always stays protected as you enter the market, or risked being cooked by the market.
Last week, I suggested the possibility of support turning into resistance zone on the Dow & S&P. On the opening trading day (24 Jun), market continued to capitulate for another 114 points, but rejected the low and rallied to form a tail at the end of the 1st trading day. The power of bulls enabled 3 days of intense rallies until we reached the short term resistance zone and market retraced after hitting that zone. Will this resistance level hold? Let’s take a look at the charts.
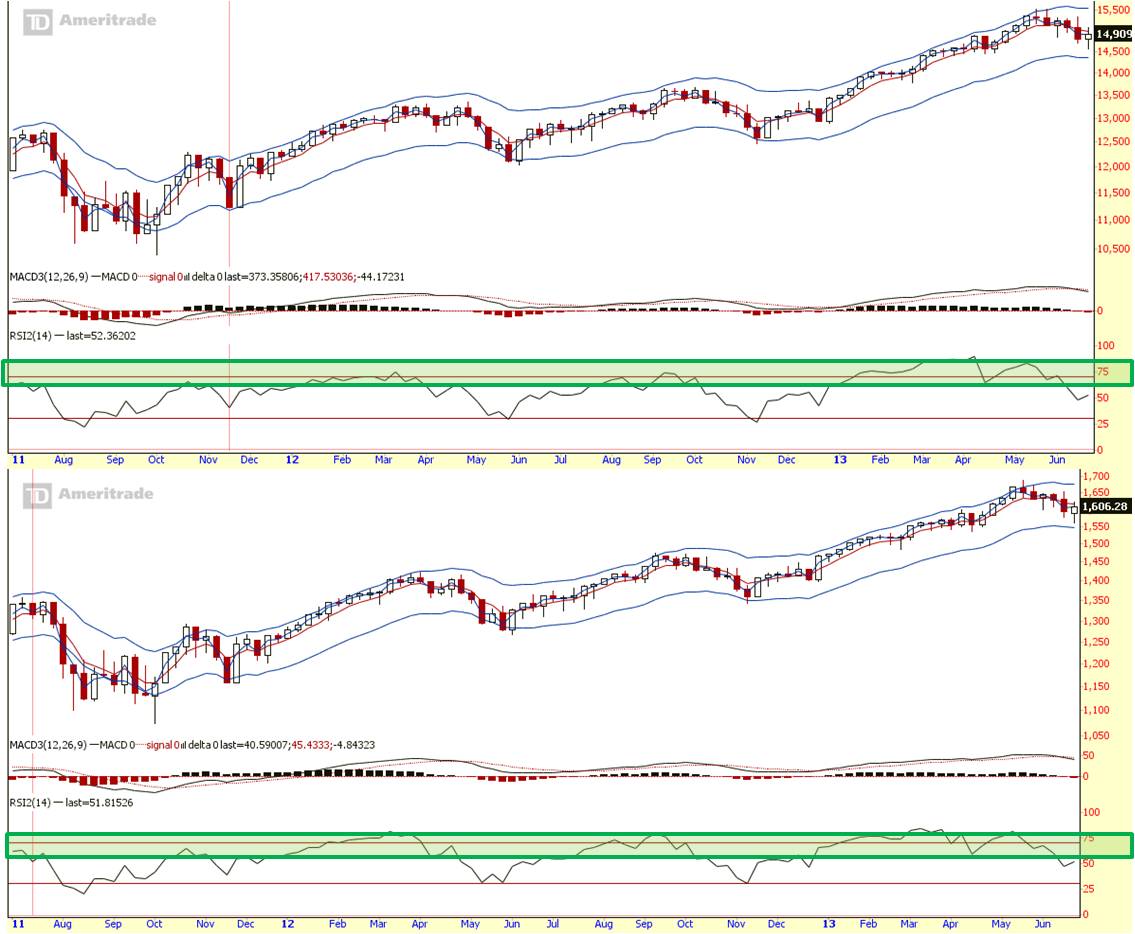
On the weekly charts, prices went down closed to the lower end of its price envelop, and reversed. EMA and RSI suggest we are in mid-term down trend. From the last two years, you can see that usually correction will caused prices to touch the lower end of its envelop before the up trend continues. Thus, there’s a possibility that the correction has ended as the price action of last week suggested a false downside breakout. Although I would prefer for RSI to move into an oversold zone before the correction ends but we cannot denied what the market might be doing.

On the daily charts, we are now sitting on slightly lower than the resistance zone. If prices breaks above the red zone (refer to the chart above), and stays above that zone, it increases the possibility that this is no longer a bounce from the down trend.
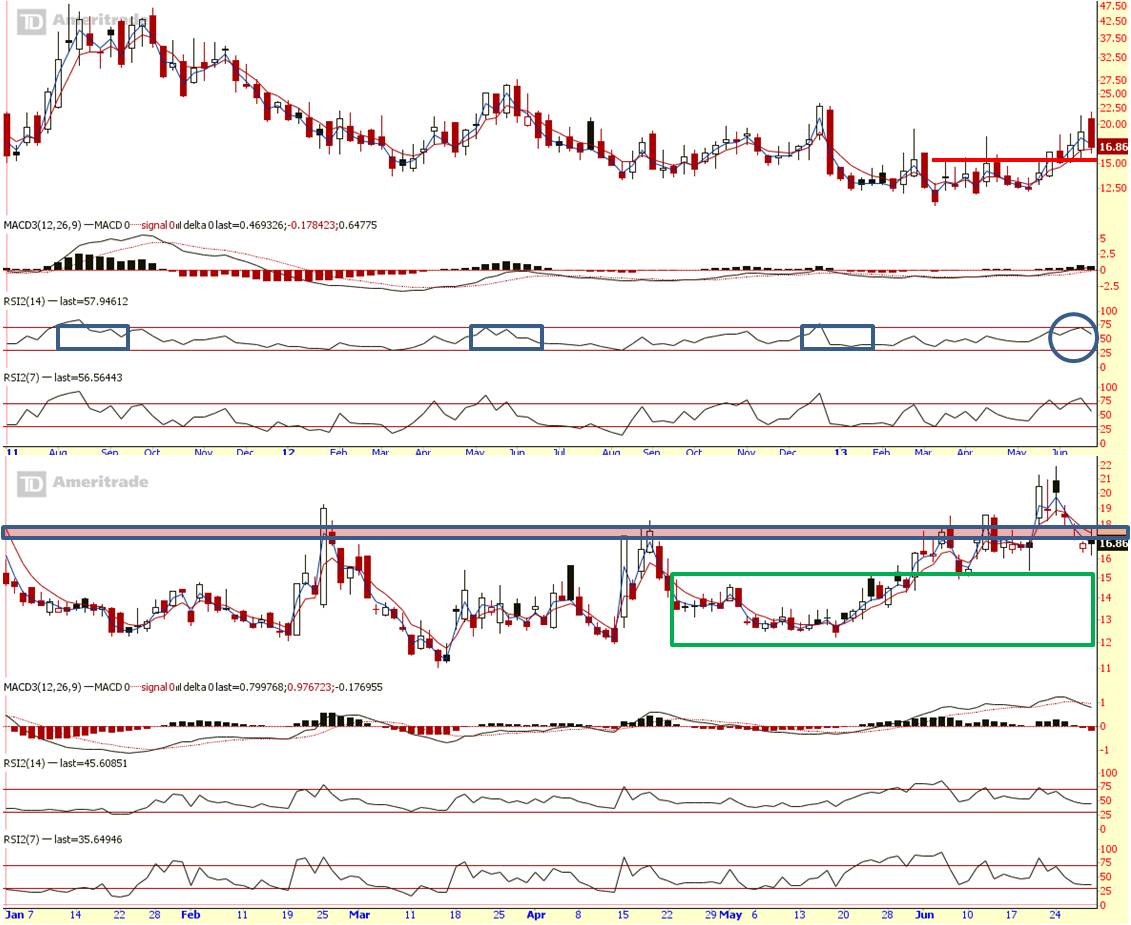
After VIX (fear index) weekly RSI went into overbought zone, prices reversed. As mentioned, whenever VIX is near oversold zone, strong rallies usually follows. VIX daily now sitting on short term resistance zone. Should the market continue its rallies, $15 would serve as a support. If support fails to hold, it would means Dow and S&P resistance has been broken, favouring the bulls.
Summary:
Midterm view:
We are in mid-term down trend possibility of an end of the correction.
Short term view:
If resistance is broken, and VIX support failed to hold, end of correction confirmed. But there’s a couple of resistance levels that the market needs to break through after the 1st resistance level is broken. Which means, there’s a chance market can be quite volatile during this trading ranges.
Cheers
Strongerhead ways to becoming a better trader
NOTE: All information provided “as is” for informational purposes only, not intended for trading purposes or advice.
