I’ve been out of action for a while. Have plenty of excuses why I had skip my market homework since 6 Jan. IT issue, workload issue, Chinese New Year preparation, and most of all, lack of discipline and determination. I am still suffering from my neck injury but I guess it is time to pick up the momentum again.
For the last one month, the market has been really volatile. Jan 2014 wasn’t as bullish, but last trading week ended with a bang for the bulls. So, what’s next? Let’s take a look at the charts.
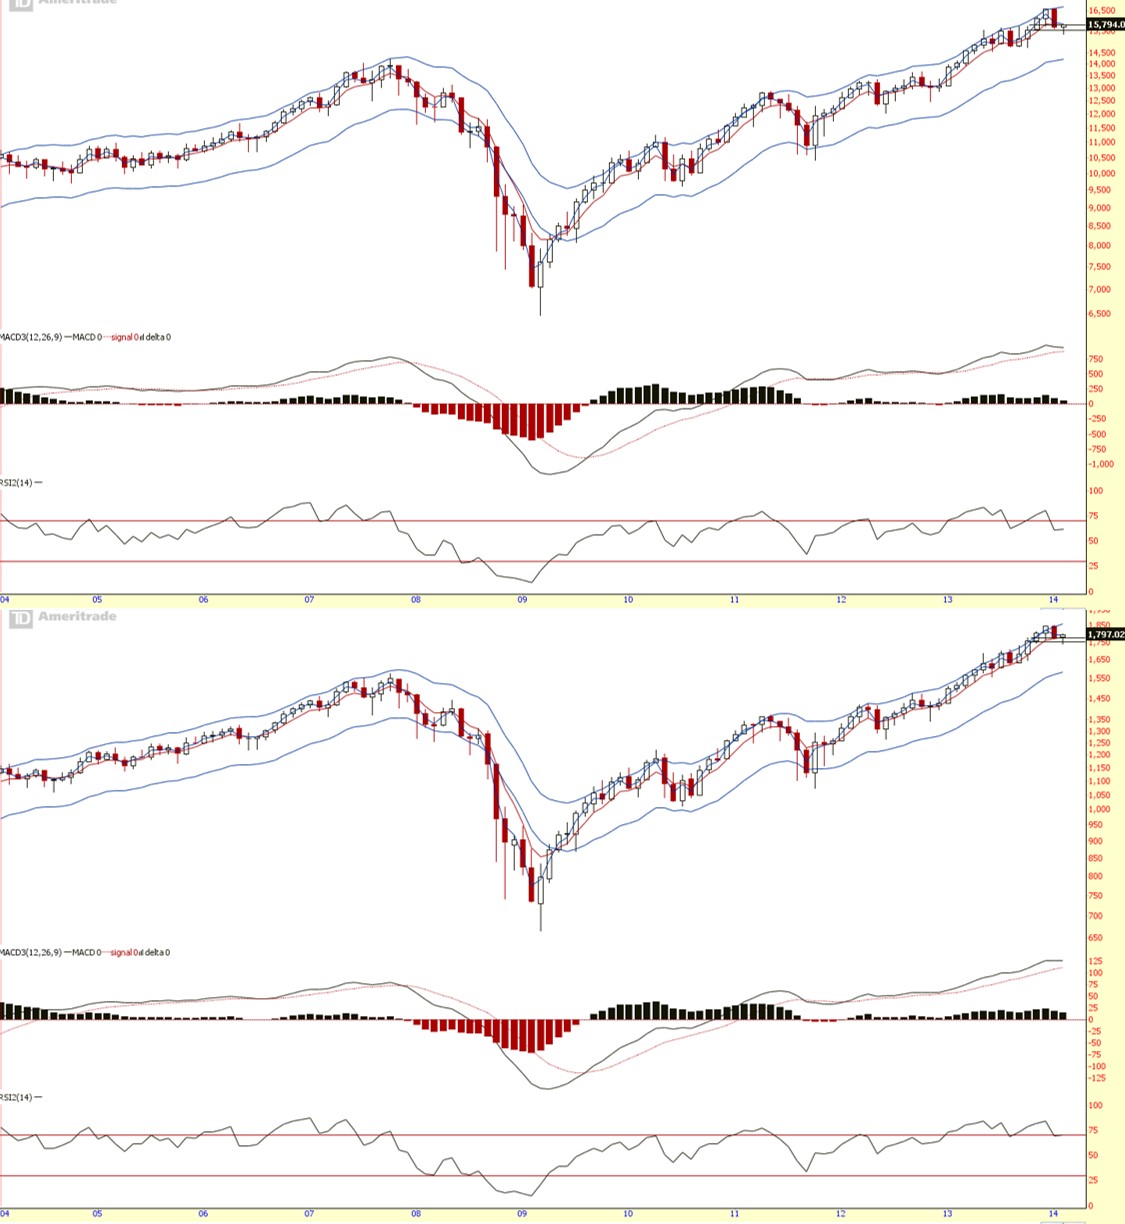
Long term chart is still UP despite the pull back. Jan ended in the red but Feb price action as of last week looking positive. I would say we are at a critical level at the moment based on RSI. It has ticked up again which signal the uptrend has resumed. If it ticks down and break below 70 for the S&P, we need to reassess the trend again for a deeper pullback where prices gets to the bottom of the price envelop which has not happened since 2012. For that to happen, the mid term trend must start to give way first. Let’s see if that is looking to happen below.
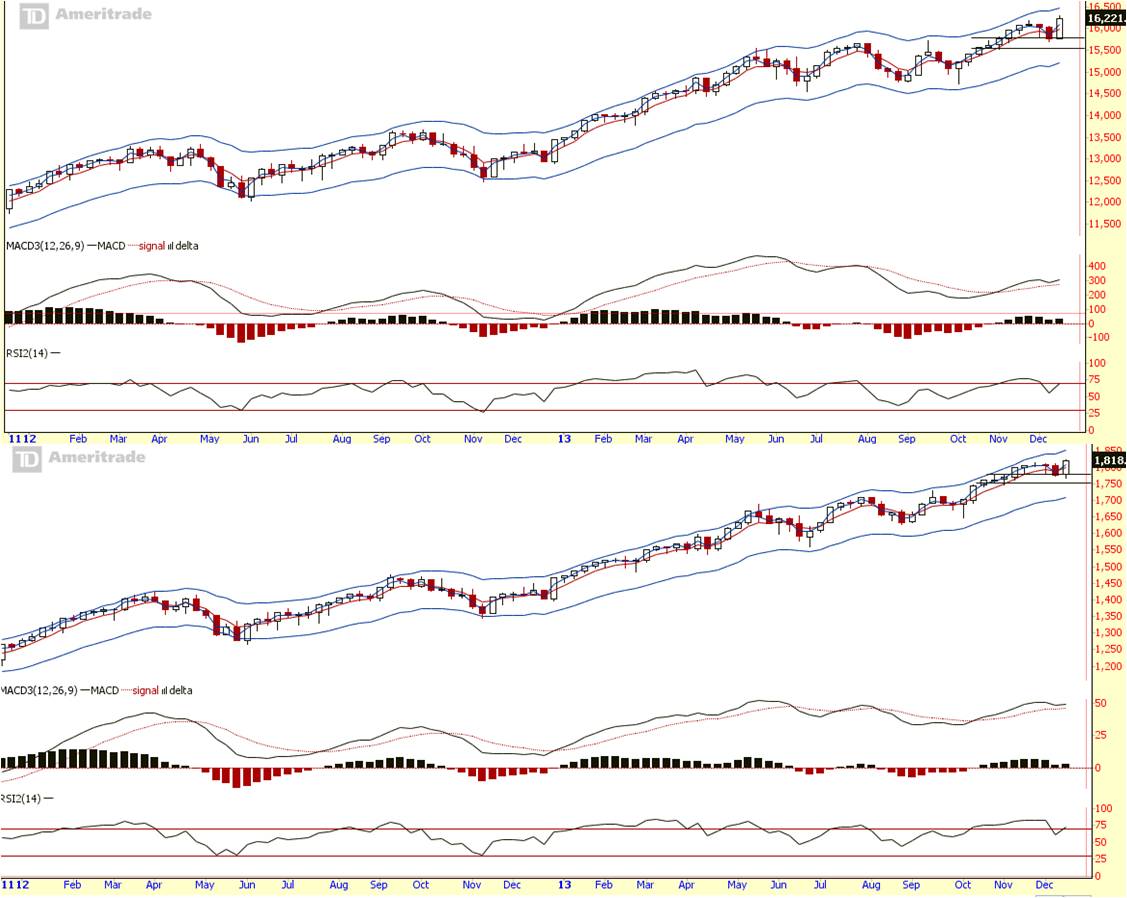
On the mid term trend, it is still down. But last on last week price action, prices has rejected its low as prices reaches the bottom of its price envelop. RSI is near its low as well, where a sustainable rally pushing price near the top of its envelop is likely to happen again. But prices does not go up in the straight line. Let’s see if prices will continue its upwards movement based on daily chart outlook below.

On the daily chart, the trend has turned up. RSI shows there’s some space still for more upside before it gets overbought. The only barrel is the resistance level. If the market breaks resistance level this trading week, it can push prices to the overbought zone. For this to happen, fear must be curb. Let’s see how much fear is it in the market below.
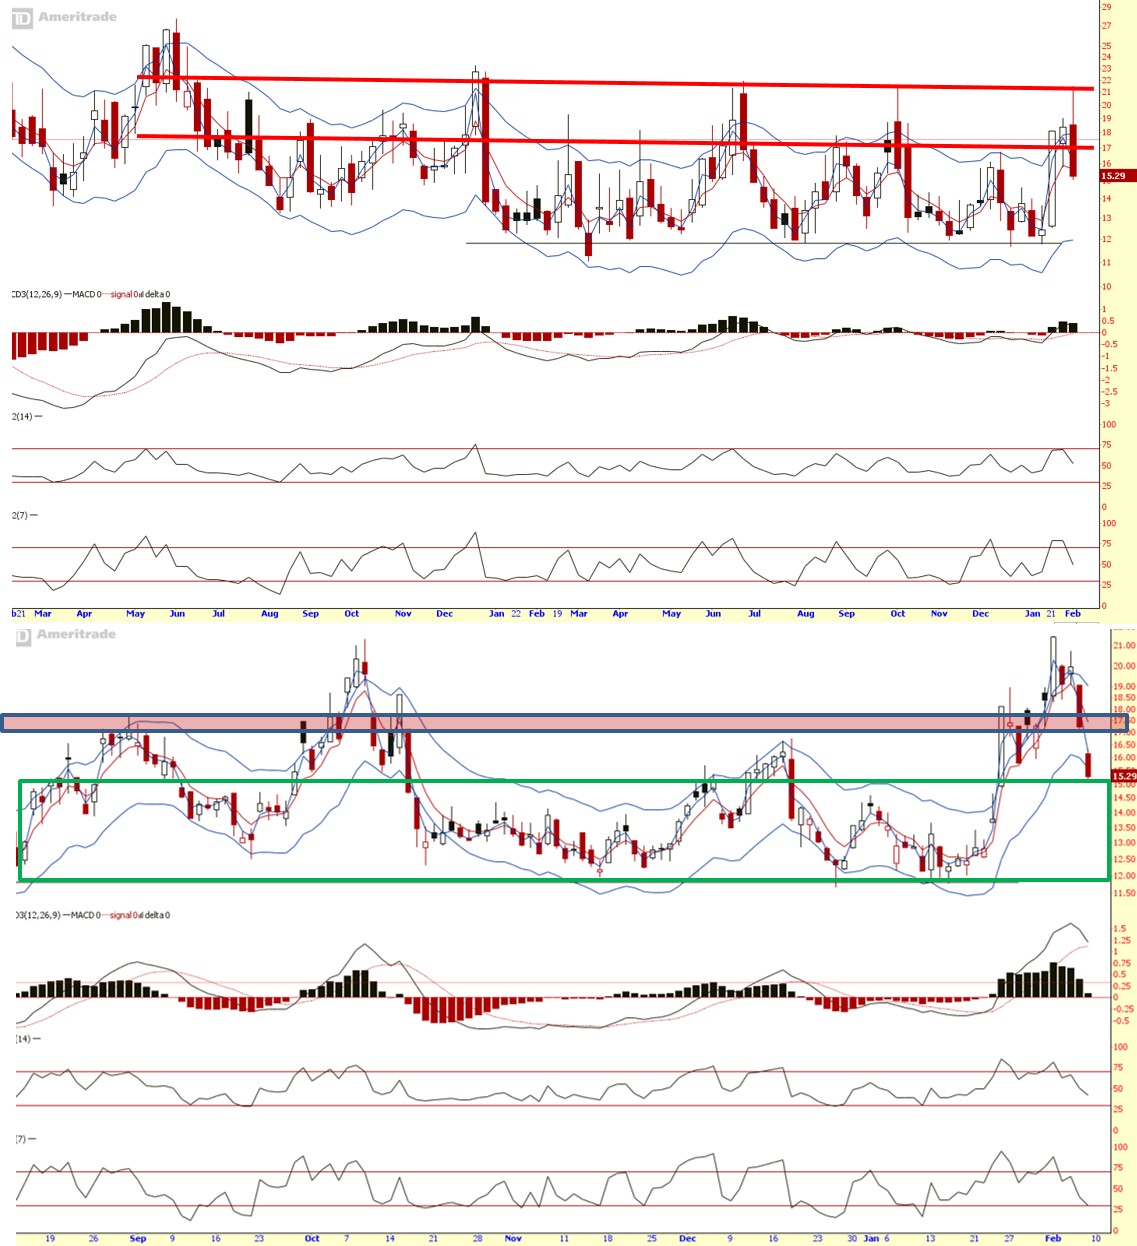
VIX (Fear index) mid-term price has reached its extreme level and came back down. VIX Short term price suffered a huge drop from last trading week causing RSI to be near its oversold zone. Possible bear attack in the next trading week.
Summary:
Long term (monthly chart):
UP
Mid term (weekly chart):
DOWN
Short term (daily chart):
UP
I won’t be surprise prices pulls back in the coming trading week. But unless VIX rallies to a point causing Dow and S&P trend to turned back down, I’m on the side of the bull.
Cheers
Strongerhead ways to becoming a better trader
NOTE: All information provided “as is” for informational purposes only, not intended for trading purposes or advice.
