I missed another week of trading homework due to Dengue Fever. There is a series of unfortunate events happening to me of late. Laptop was not in working condition. Physical state was hammered by dengue fever. Work was negatively affected by nasty complaints. But fortunately, laptop is still under warranty, and was in a fixable state. My blood platelets stabilised within days instead of weeks. Although I had received one nasty complaint, but I had received numerous encouragements from peers, students and my ex-students, which got me to stand up on my feet again and kept my faith.
These lessons taught me that bad events happen all the time, so does the good. It is a matter of us to focus on the good or on the bad and benefit from it instead of being brought down to our knees by it.
The market is like our life too. Or should I say our life resembles the market. The market can be up, but at the same time going down within an uptrend. And vice versa. We need to learn how to recognise them and benefit from it, instead of being victimised. Having said that, let’s flip to our charts for some insights into what might happen next week.
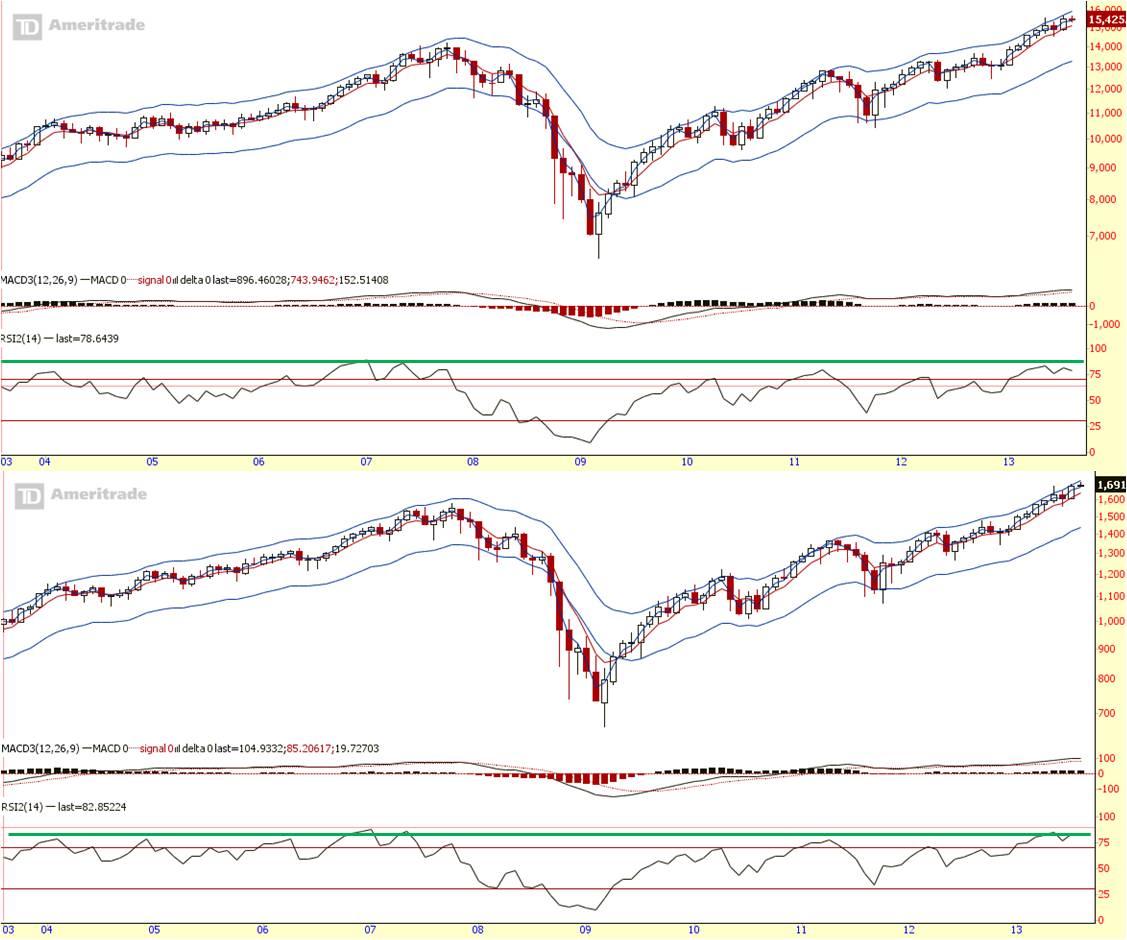
July closed profitably but Aug started in the red. But the trend is still UP in the long term as long as all vitals are still pointing to the upside.
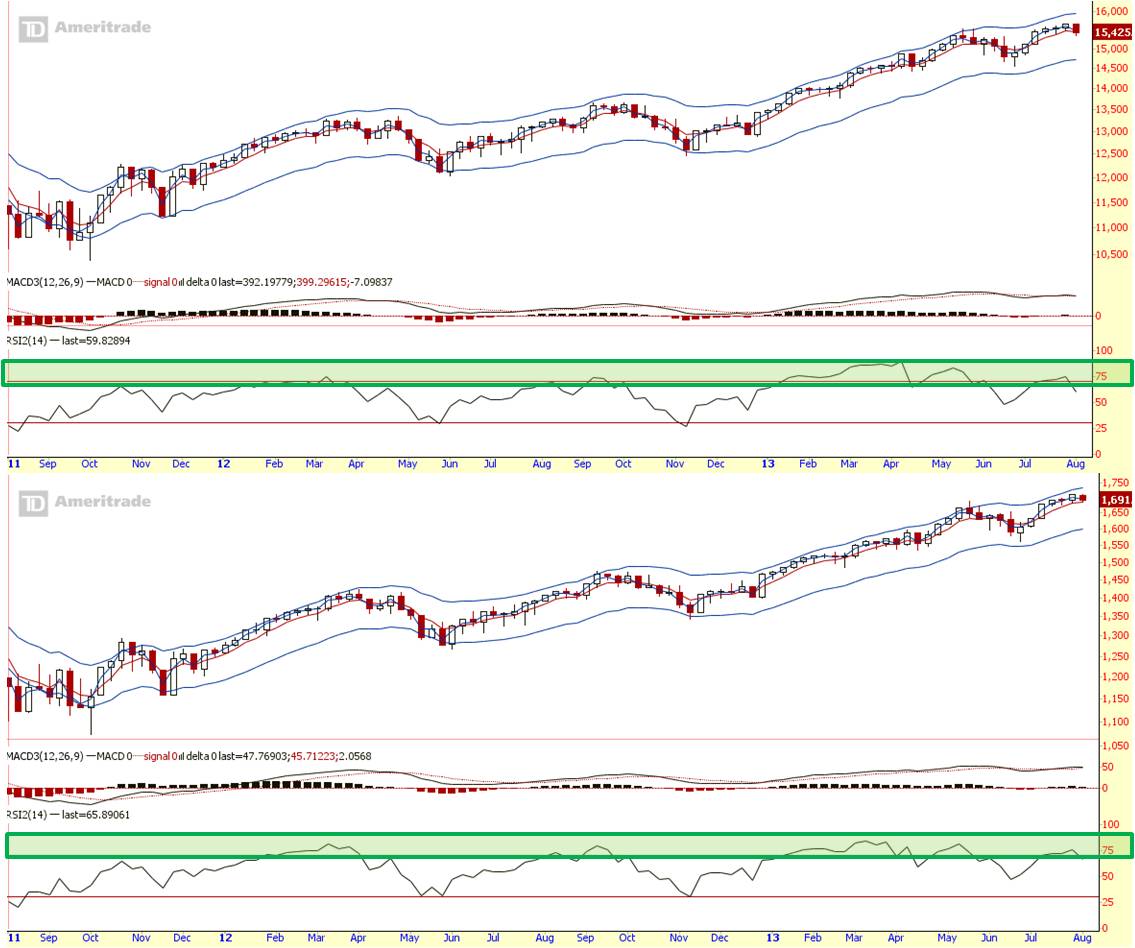
The intermediate term, the trend is slightly threatened. RSI is stalling, and EMA is looking to cross. A divergence has formed with the market going higher but MACDH and RSI moving lower. Next week price action will confirm if the intermediate trend has changed its tide.
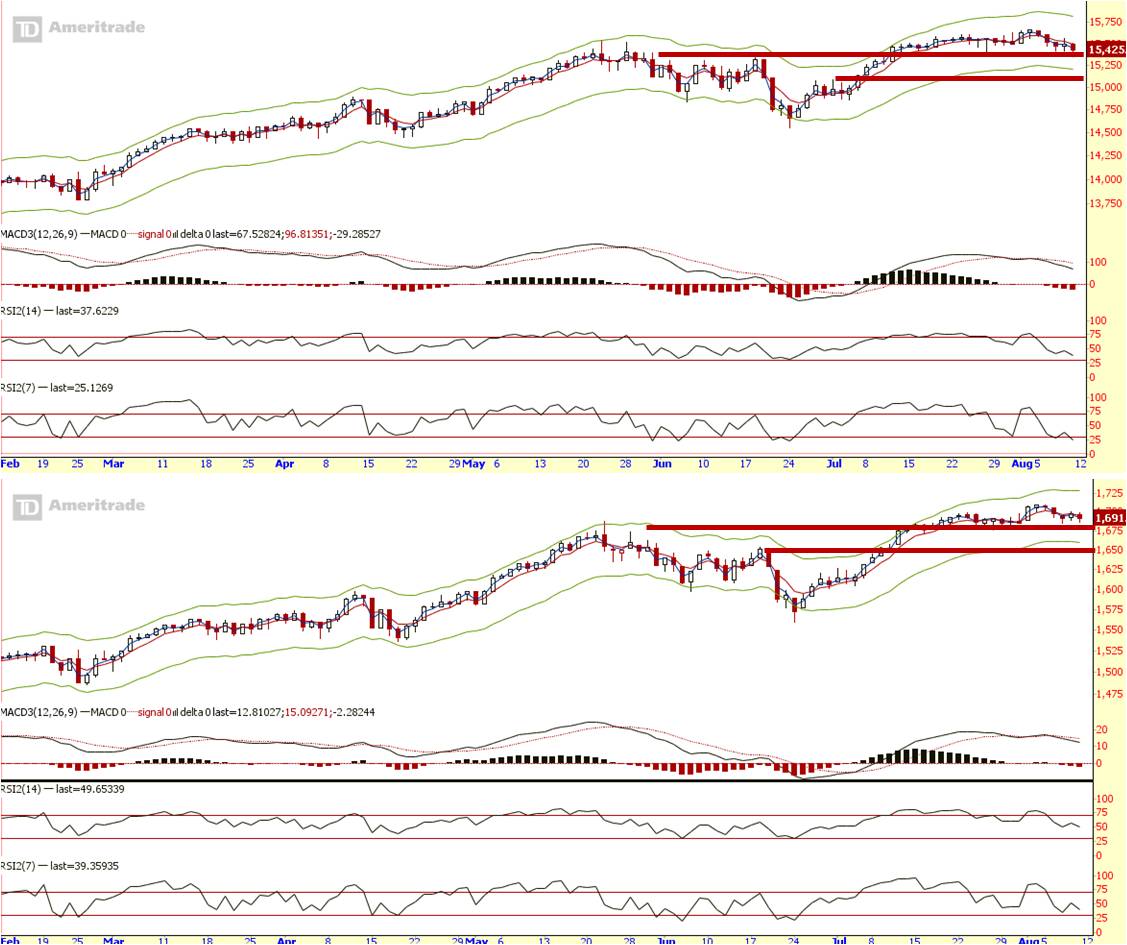
The short term trend is sitting on the 1st line of short term support. RSI is not in its extreme zone, but it is still possible to trigger a bounce as a result of it being near short term oversold zone.
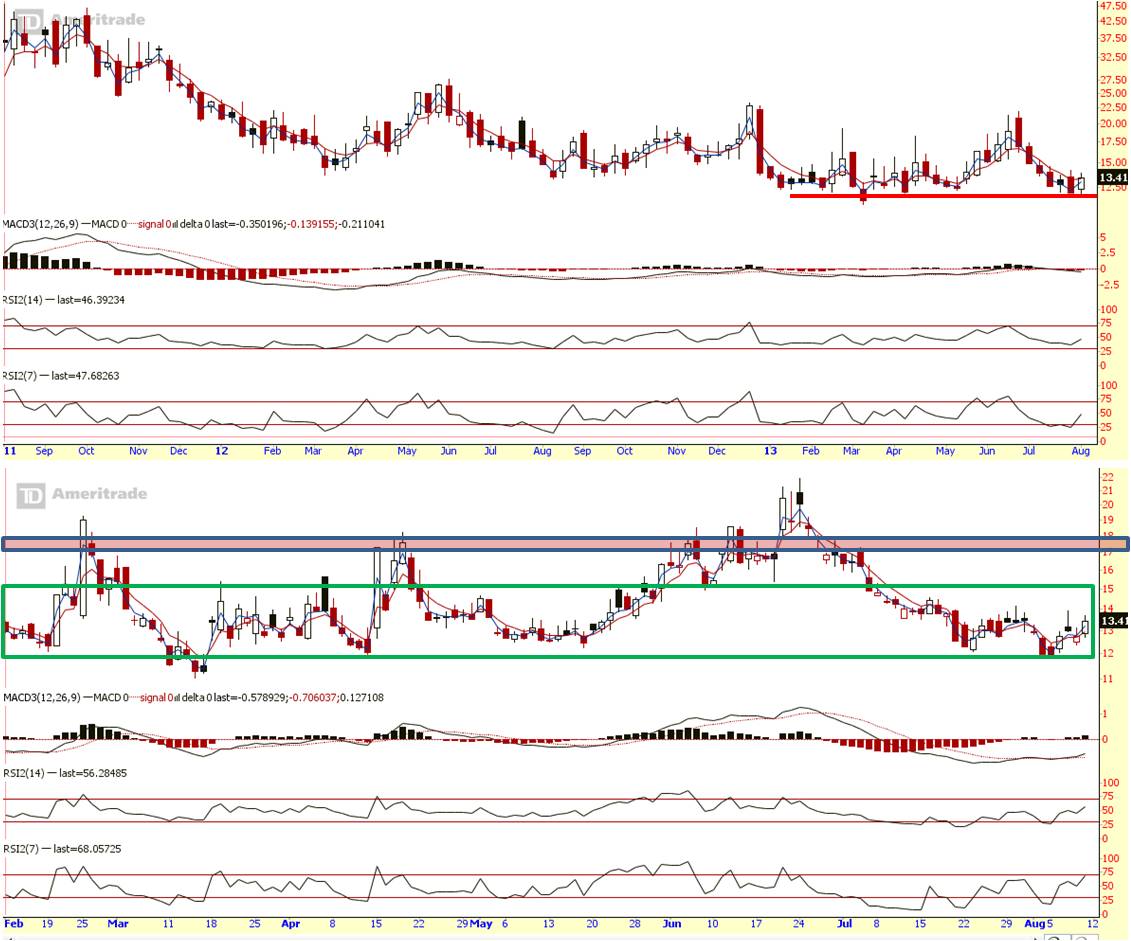
VIX (Fear index) weekly as reacted to its support line and bounced away from its previous low. Which doesn’t surprise me as on my previous post, I said that VIX does not enjoy staying below the edge of the green box for too long.
VIX daily is near short term resistance, and it increases the possibility of a short term rally. Will have to see how strong the rally goes to find out if the short term down trend can continue. However, so long price action is kept within the green box, and drawn down would be considered a dip in the up trend.
Summary:
Long term view:
Monthly trend is UP.
Mid term view:
Weekly trend is UP, on the verge of being breached.
Short term view:
Possible rally might happen in view of VIX near short term resistance, Dow and S&P near short term oversold. There’s no guarantee that it will happened, but if it does happen, watch if there’s follow through from the rally. Without a strong price follow through, the force would be with the bears.
Cheers
Strongerhead ways to becoming a better trader
NOTE: All information provided “as is” for informational purposes only, not intended for trading purposes or advice.
