Market rallied higher again. How long will it continue to rally? Let’s see what the chart says.
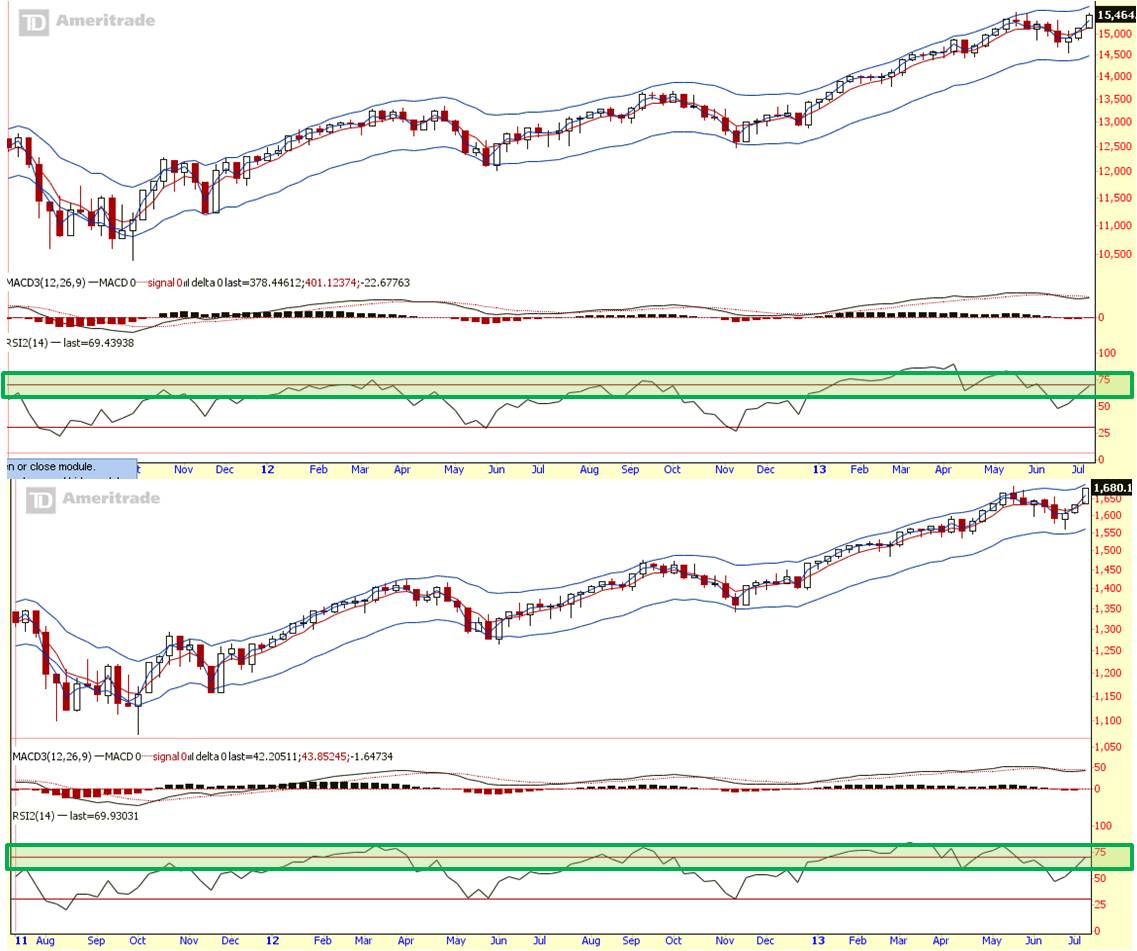
On the weekly charts, the vitals are all looking good, signalling the trend is UP. There’s more room climb with a good potential to hit new high.
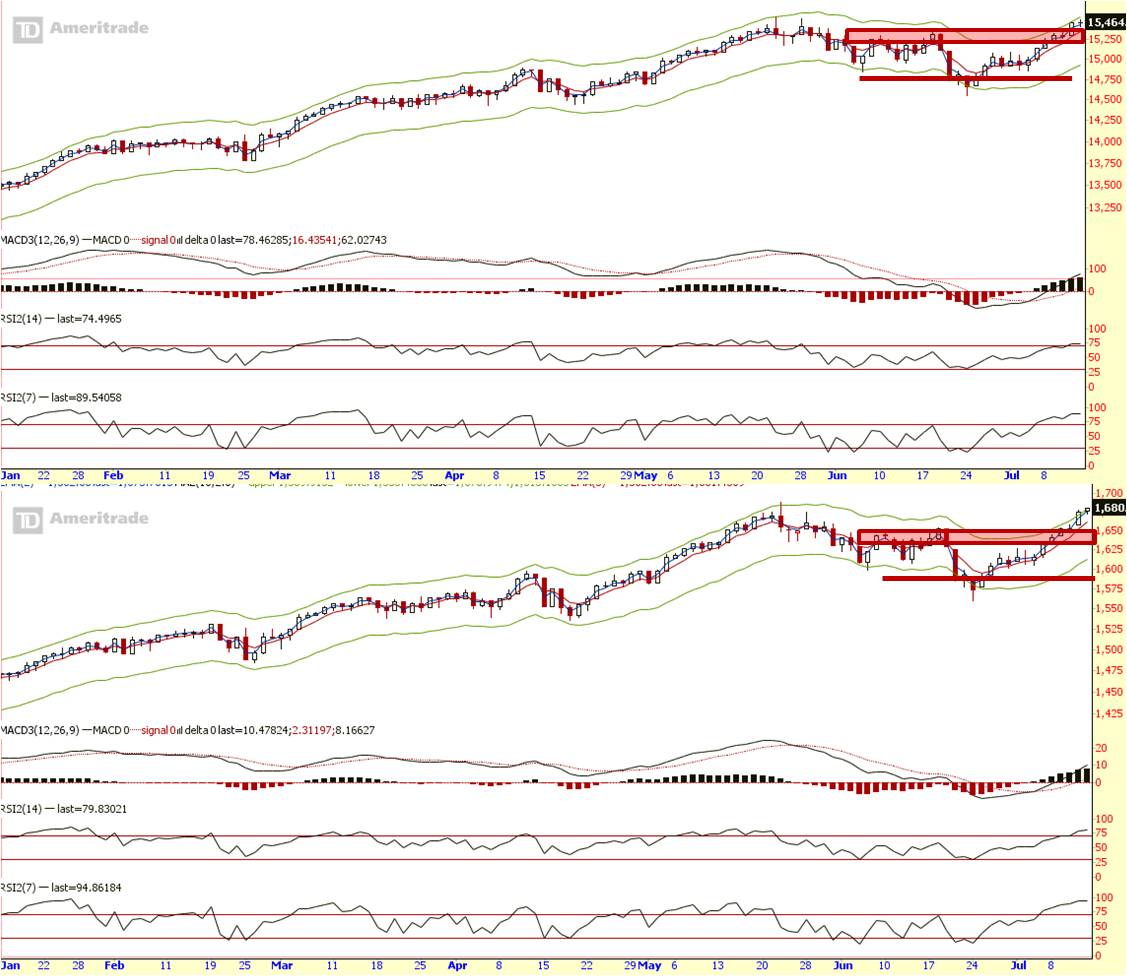
On the daily charts, RSI reading led me to believe the market is a bit overcooked in a short term. But MACDH, with price breaking & staying above resistance level on Friday closing, and its bigger ‘brother’ (weekly trend) do not seem to suggest any sign of the party that will dampen the bulls.
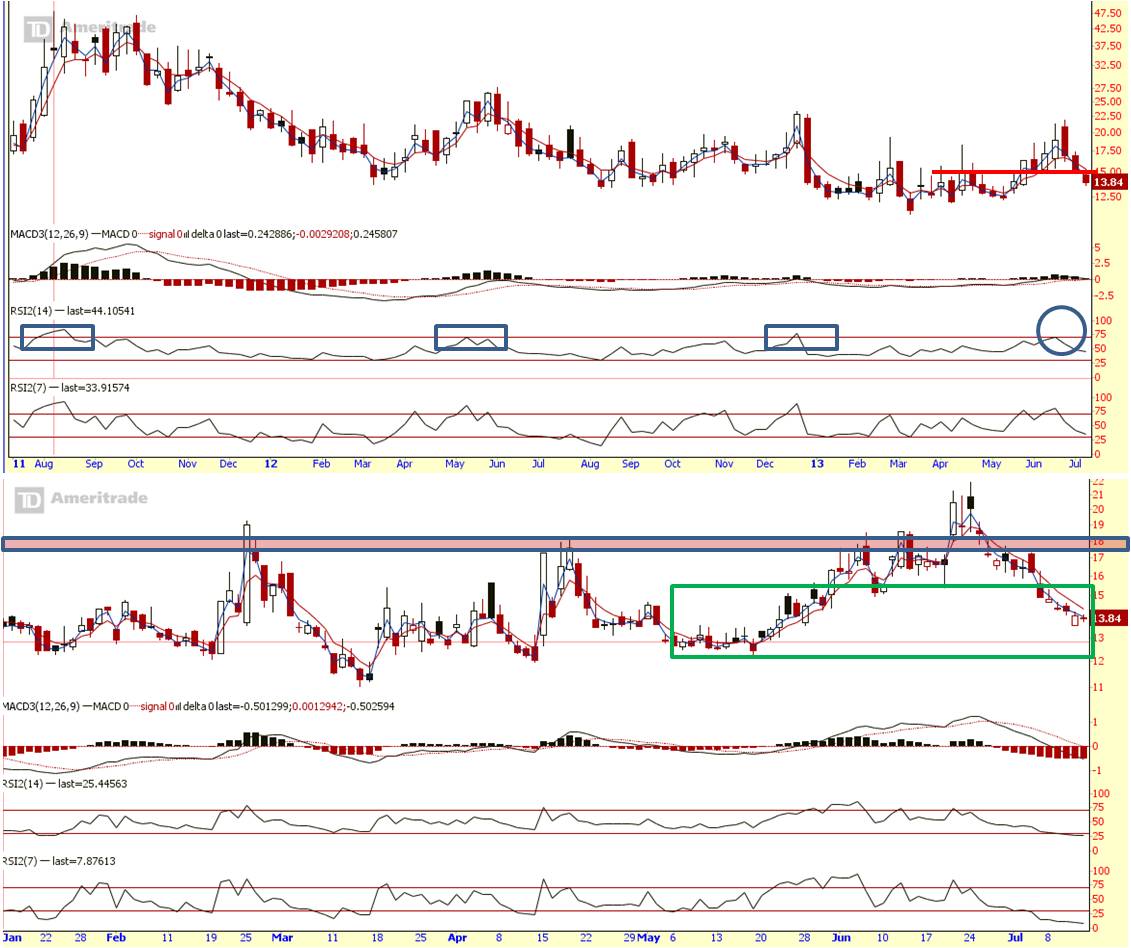
VIX (fear index) weekly price broke support. Price has fall back into the green box zone, which suggest fear is backed into a ‘contained’ zone. But both RSI on weekly and daily has reached oversold zone.
Summary:
Midterm view:
Weekly trend is UP.
Short term view:
With VIX in oversold zone, any pull back would not be surprising to cool off the overbought condition, with its immediate support at the red zone. If that happens, I would consider that a dip in an uptrend.
Cheers
Strongerhead ways to becoming a better trader
NOTE: All information provided “as is” for informational purposes only, not intended for trading purposes or advice.
