All gains from week of 6 Dec were probably wiped out by the bears last week. The pattern i’ve highlighted on the VIX deserve more attention then. Let’s take a closer look at it in this week’s trading homework.
Long term trend is UP. The monthly candle is now deeper into the red. Should moving average makes the cross, long term trend will be in correction mode. Still some way to go. Let’s look at the mid term trend for sign of such occurrence.
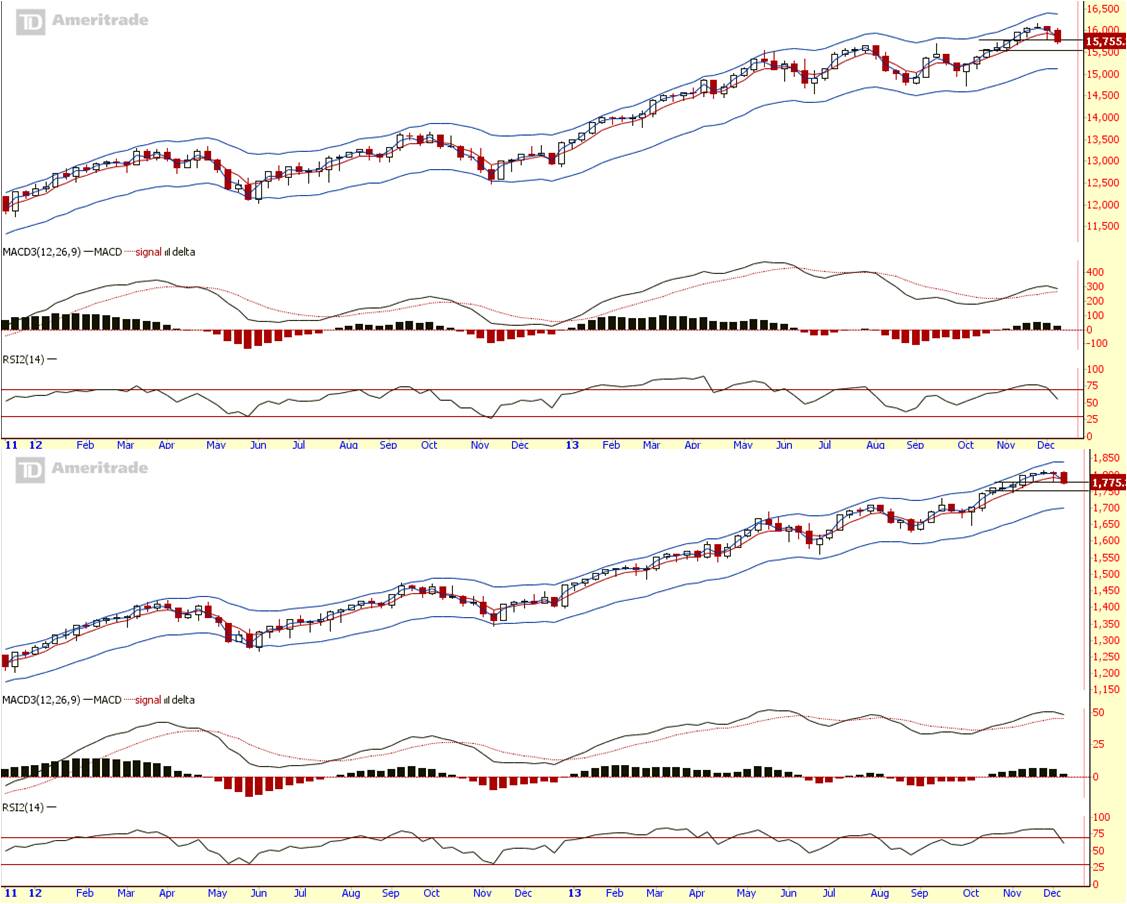
Mid term trend is neutral now, on the verge of a mid term change of direction. It broke its immediate support, leaving the 2nd support (S&P around 1750) to hold the fort. In the last two years, RSI has only turn down slightly and rallied higher again twice. The rest of the 3 times, a deeper dip of at least 50% of its price envelope.
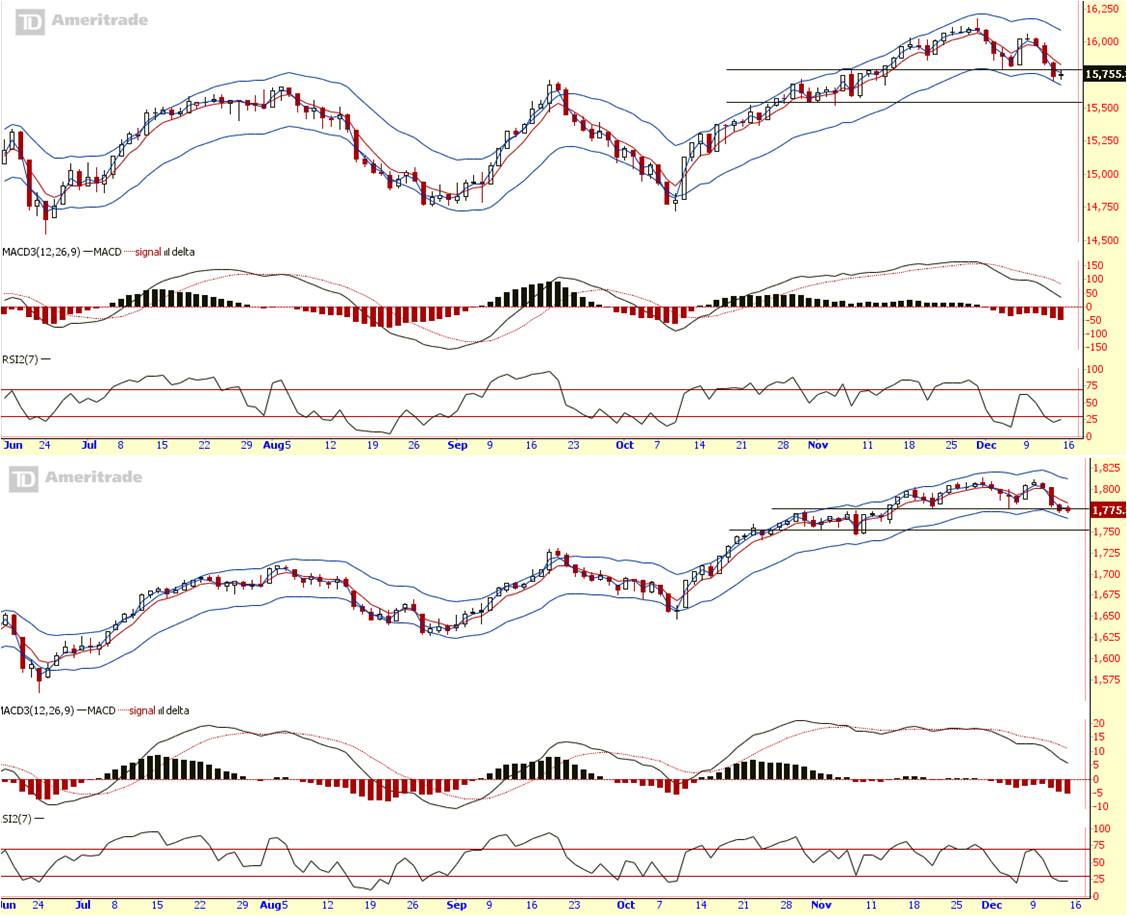
The short term trend is down. Dow broke short term support. S&P sitting on the fence on its short term support. MACDH looking ugly, but RSI suggest a possible rally may be on its way. Should the rally happens, prices must break and stays above the short term support if bulls wants to be in charge.
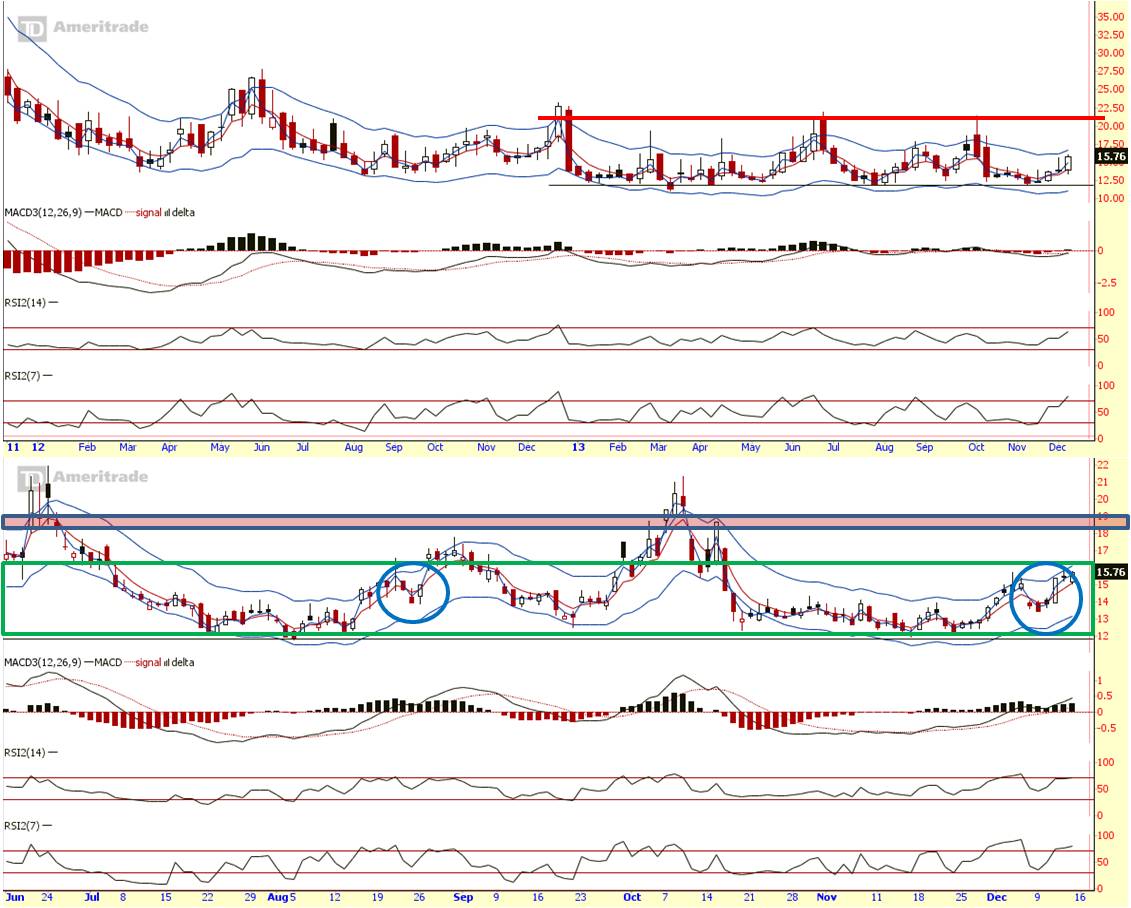
VIX (Fear index) mid-term price made a strong upward move again. This time around, it closed firmly at the top of its price envelop. Some more room to go before it breaks above its envelope and for RSI to hit the roof of its resistance level.
On VIX daily chart outlook, price pattern is getting even closer to Jul-Aug 2013 formation. It did created the bear trap and now price is sitting on the top edge of the green box which serves as short term resistance. Should the Jul-Aug formation continues, it should break above to around $17 and make its way down again.
Summary:
Long term (monthly chart):
UP (overbought)
Mid term (weekly chart):
Neutral (Relieved from overbought condition)
Short term (daily chart):
Down (but RSI is in oversold territory)
Although Mid Term view signal some danger and Short term view looks ugly. But based on VIX Jul-Aug pattern, i’ll switch side to the bulls. Bear has set a trap last week on the daily. Bulls might be setting the trap on the weekly. Here’s what i will be observing next week. If Jul-Aug VIX pattern repeats itself, more upside movement to $17 would be possible in the coming week ahead. When that happens, VIX should have some retracement to signal a price rejection at $17. If that happens, i believe this is a better time to side the bulls. If it doesn’t, Santa Claus is not coming to town. But the sales worth waiting for is here.
Cheers
Strongerhead ways to becoming a better trader
NOTE: All information provided “as is” for informational purposes only, not intended for trading purposes or advice.
