A second buying opportunity came when prices broke down last week. This time around, I quickly got out the next day to capitalise on the gains. As the market gets funkier, trading time frame gets shorter to reduce a trader’s risk. Let’s see if the market is still funky next week.
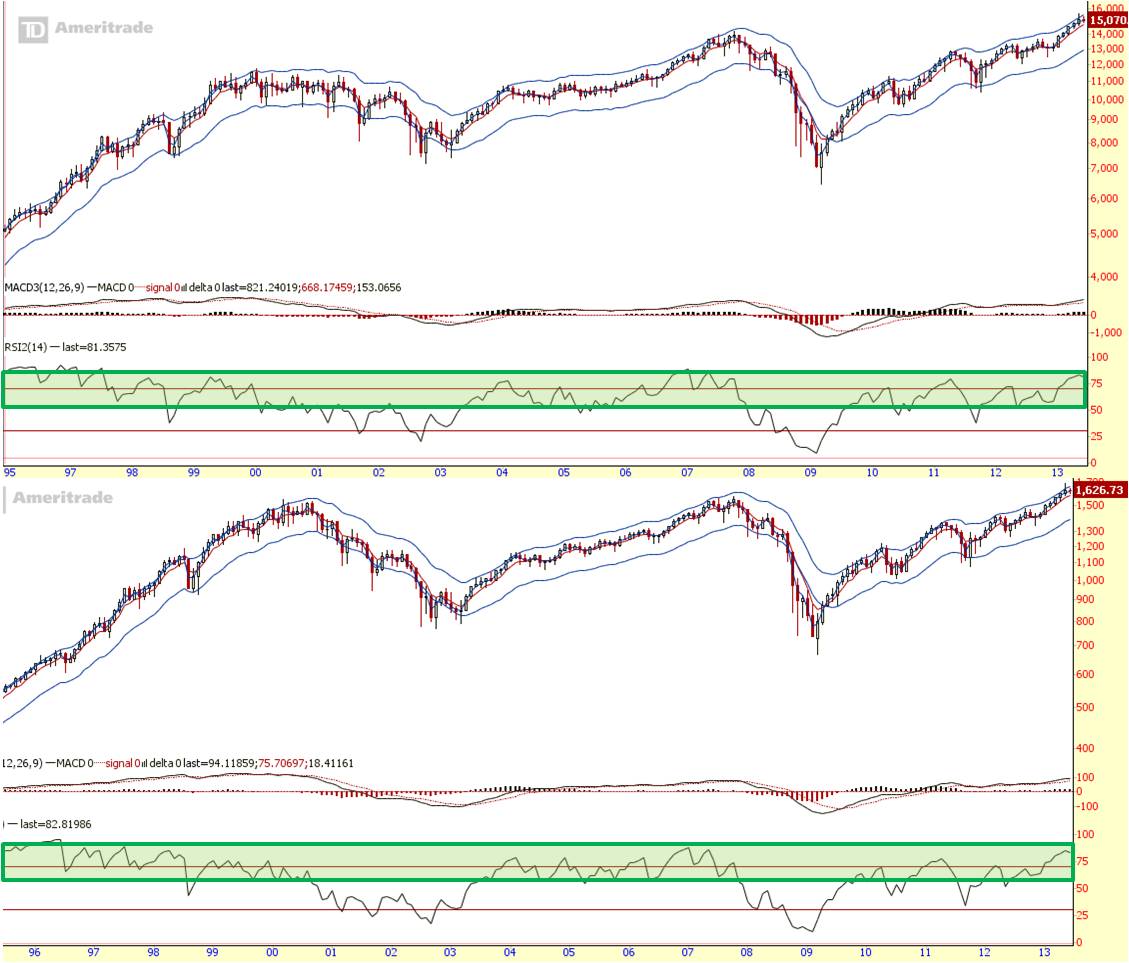
It’s been some time since I last showcased the monthly chart. Might be worth taking a quick look to hear what the charts might be saying. This is a monthly chart, which means the signals might not be immediate. It can take couple of months to crystallise if the analysis is correct. Looking at the chart since 1995, if the bull run is still in charge, RSI will stays within the green zone (as shown on the chart). The moment RSI breaks and stays below the bottom of the green zone, the bears are in control. When that happens, the best opportunity to fish for cheap stocks is when RSI reach oversold zone. Right now, we are far from oversold. In fact, we are in overbought zone. Prices are considered expensive. Not that there’s no room for profit. Just that you have to be smarter and sharper on your stock picks and exits.
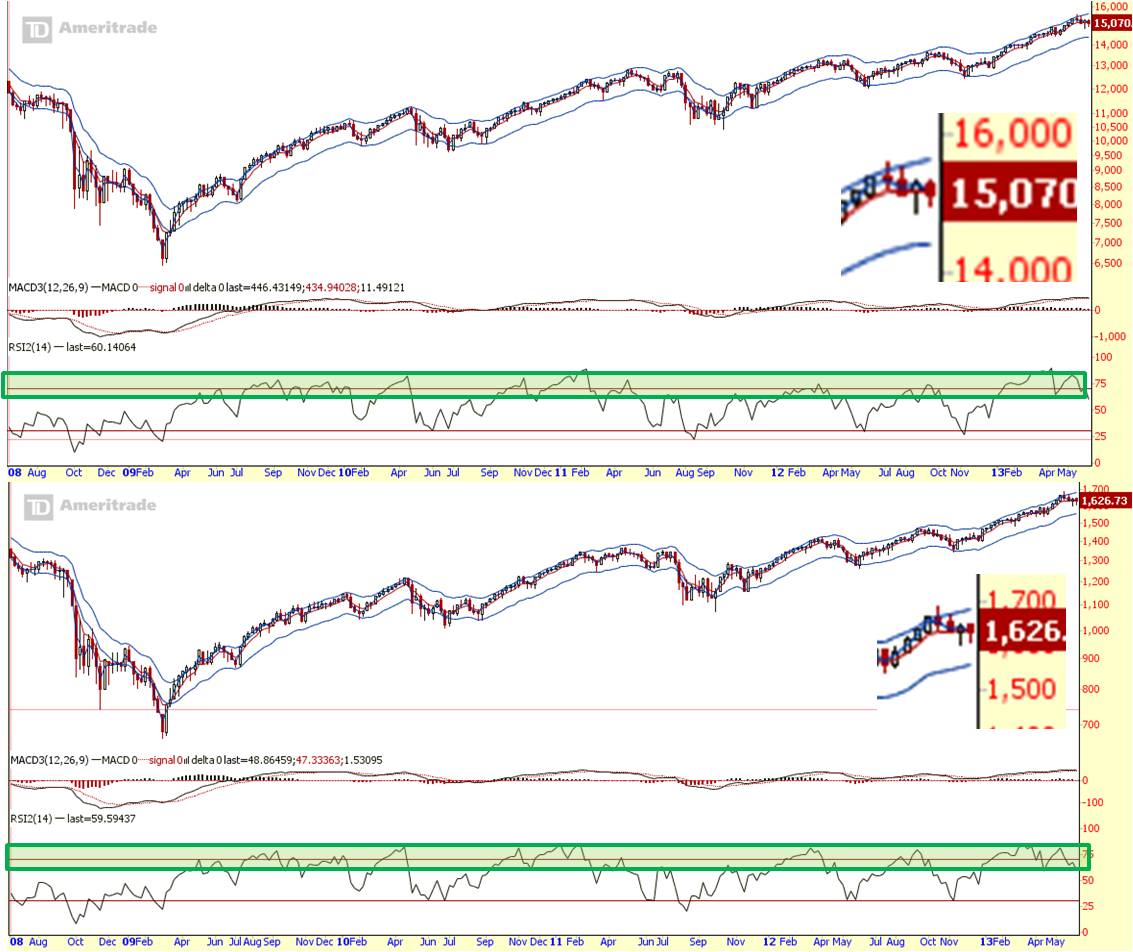
The weekly charts, we are at a pivot point where the EMA (refer to enlarged screen on the charts) is about to cross. Using the same analysis on the monthly chart, let’s see if RSI will hold within the green zone (as shown on the charts). If not, I believe we are going down.
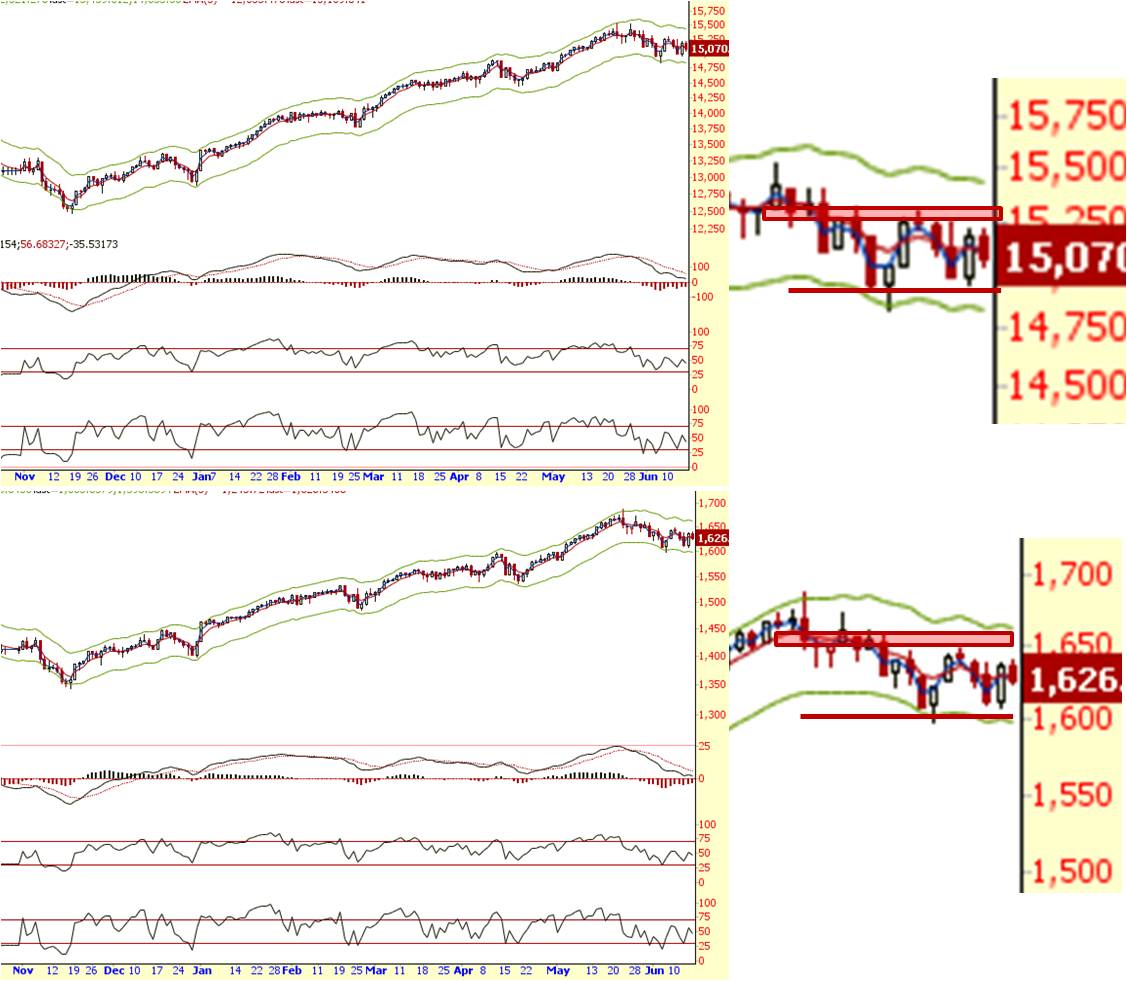
On the daily, prices are moving within a range at the moment. It rejected the low (as marked by the red horizontal line on the enlarged chart) and rose to the top of the red zone (as marked by the reddish rectangle horizontal box). As soon as it hits the top, prices reversed but before retesting the low, it rebound (S&P closed back above 1624 – might be a sign of false downside break out). RSI and prices are in neutral zone as of last Friday closing.
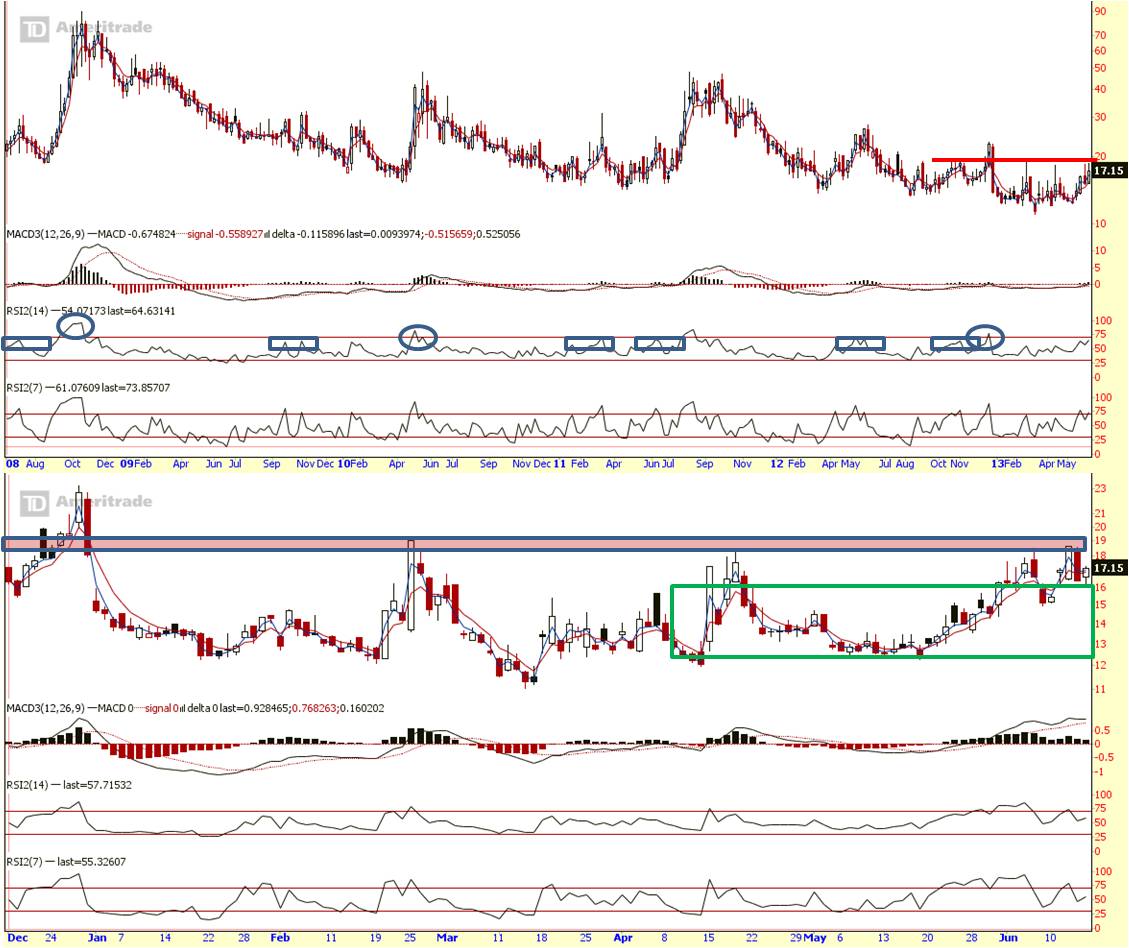
VIX (fear index) weekly reversed and now sitting near the top edge of the resistance line (marked by the red horizontal line). RSI seldom breaks above overbought zone. It only does so 3 times in the last 5 years. And 6 times in the last 5 years, RSI was only closed to overbought zone and it reversed. Nevertheless, when RSI is near overbought or breaks above overbought, there’s a high chance the bulls will fight back.
VIX daily price broke above the green zone but trading within the tight range between the spaces from the red shaded area to the green box zone (as shown on the chart). RSI in neutral zone just as the Dow and S&P daily chart. The market is undecided.
Summary:
Midterm view:
Trend is UP. Watch EMA and RSI for more confirmation that the trend stays intact.
Short term view:
False downside break out from its low on Dow and S&P. False upside break out on the VIX. Prices are now in neutral zone. In another words, it is no man’s land. This means to say we are directionless at the moment in the short term.
If someone were to point a gun at my head for direction, I believe VIX will continue to bounce away from its support (Green Box on the chart) while Dow & S&P will dropped further towards its previous low first, followed by another rally on the Dow and S&P with all prices staying within the range. Will reassess if prices break out of the range.
Cheers
Strongerhead ways to becoming a better trader
NOTE: All information provided “as is” for informational purposes only, not intended for trading purposes or advice.
