The dip came last trading week. I expect bullish resistance based on the charts below.
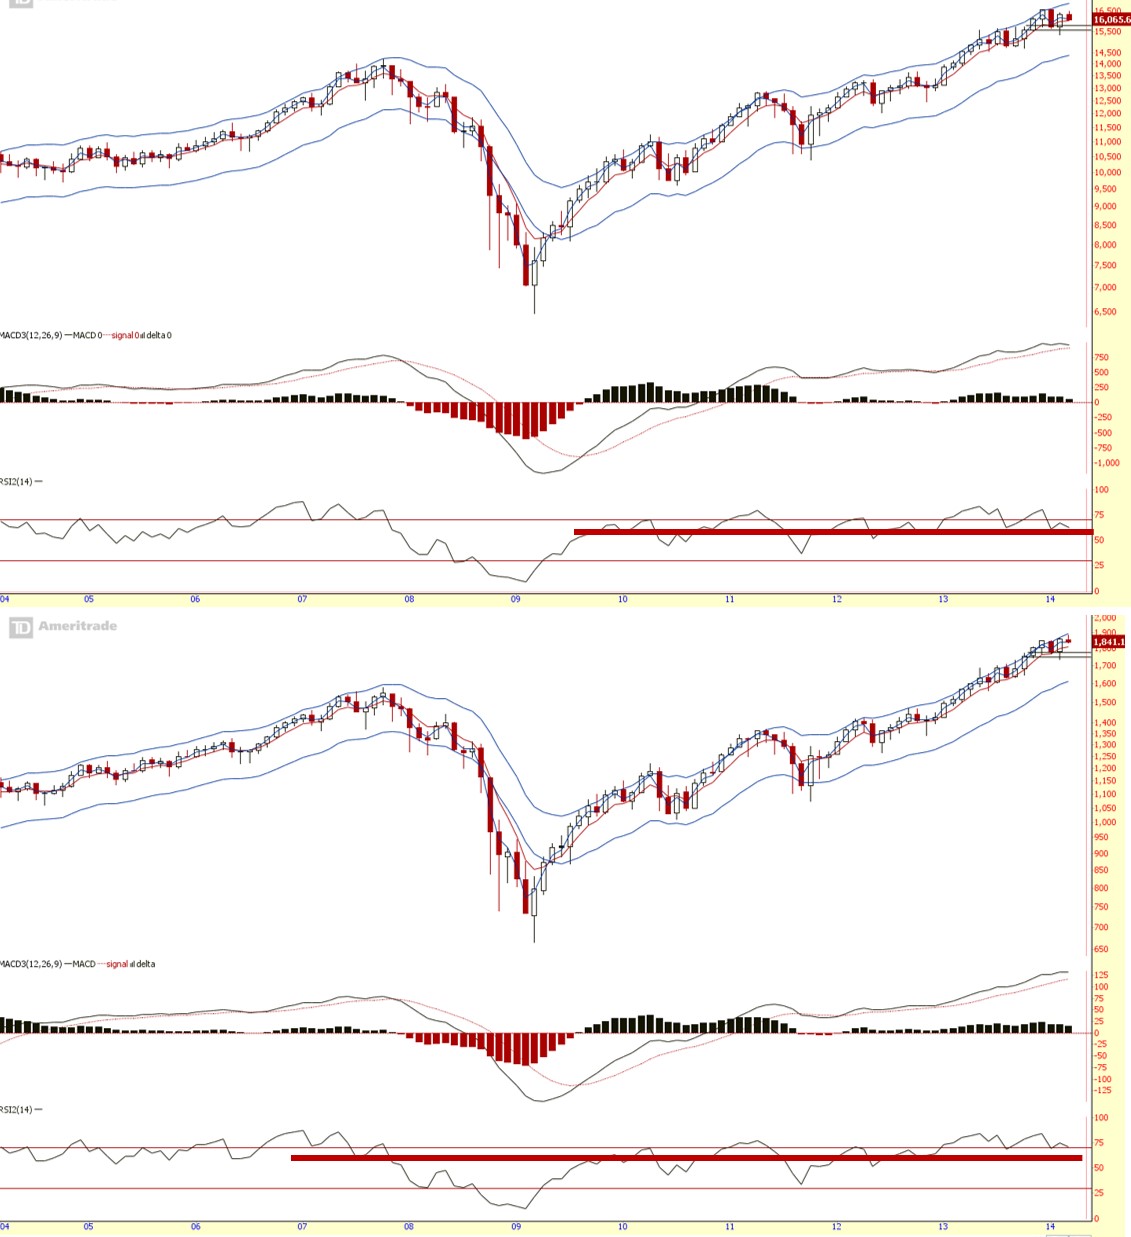
Monthly chart (which helps project the longer term perspective of the market trend – chart not shown this week) is into the 3rd week of the month. Right now, prices is looking bearish. The trend is in a pivot stage where it might turn the tide favouring the bears. I’d drawn a support line on RSI. Should prices breaks below that level, chances of prices pulling deeper will be largely increased. What are the chances this will happen, let’s take a look at the weekly chart for insights.
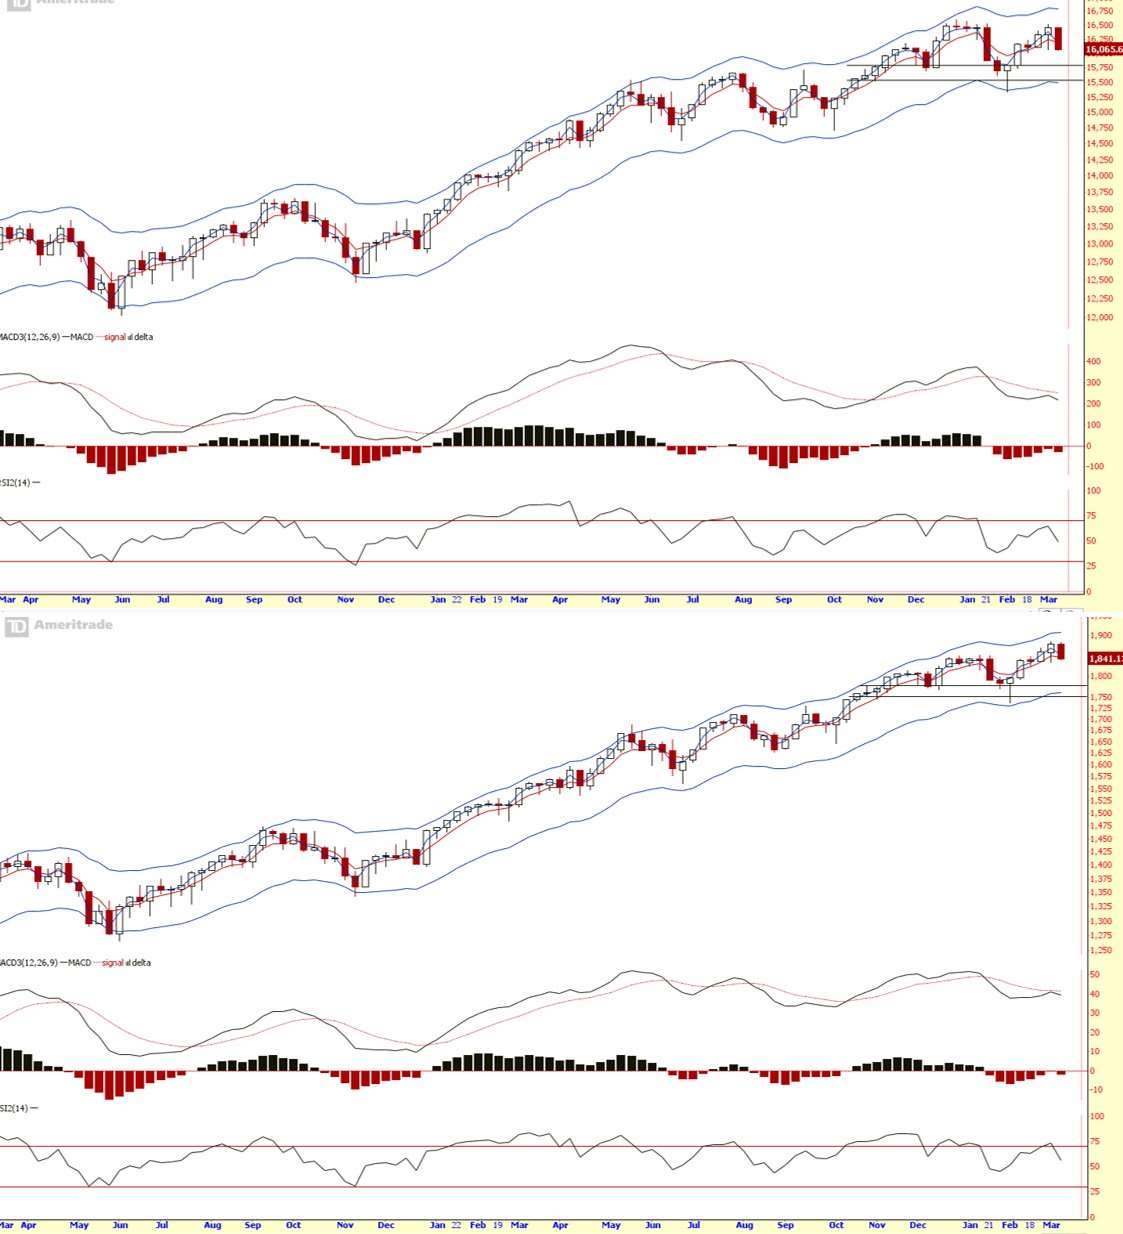
Weekly chart (which helps to project the mid term perspective of the market trend – as shown above) is at its pivot stage too where the mid term trend is also on the verge of turning depending on the coming week’s price action. MACDH Div has formed with a missing right shoulder, which now favours the bears. But there’s a pattern on RSI that might worth some attention. On two occasions in the past 2 years, whenever RSI is nearing its bottom and rebound, it did pullback before rallying higher again. Will it repeat the 3rd time?
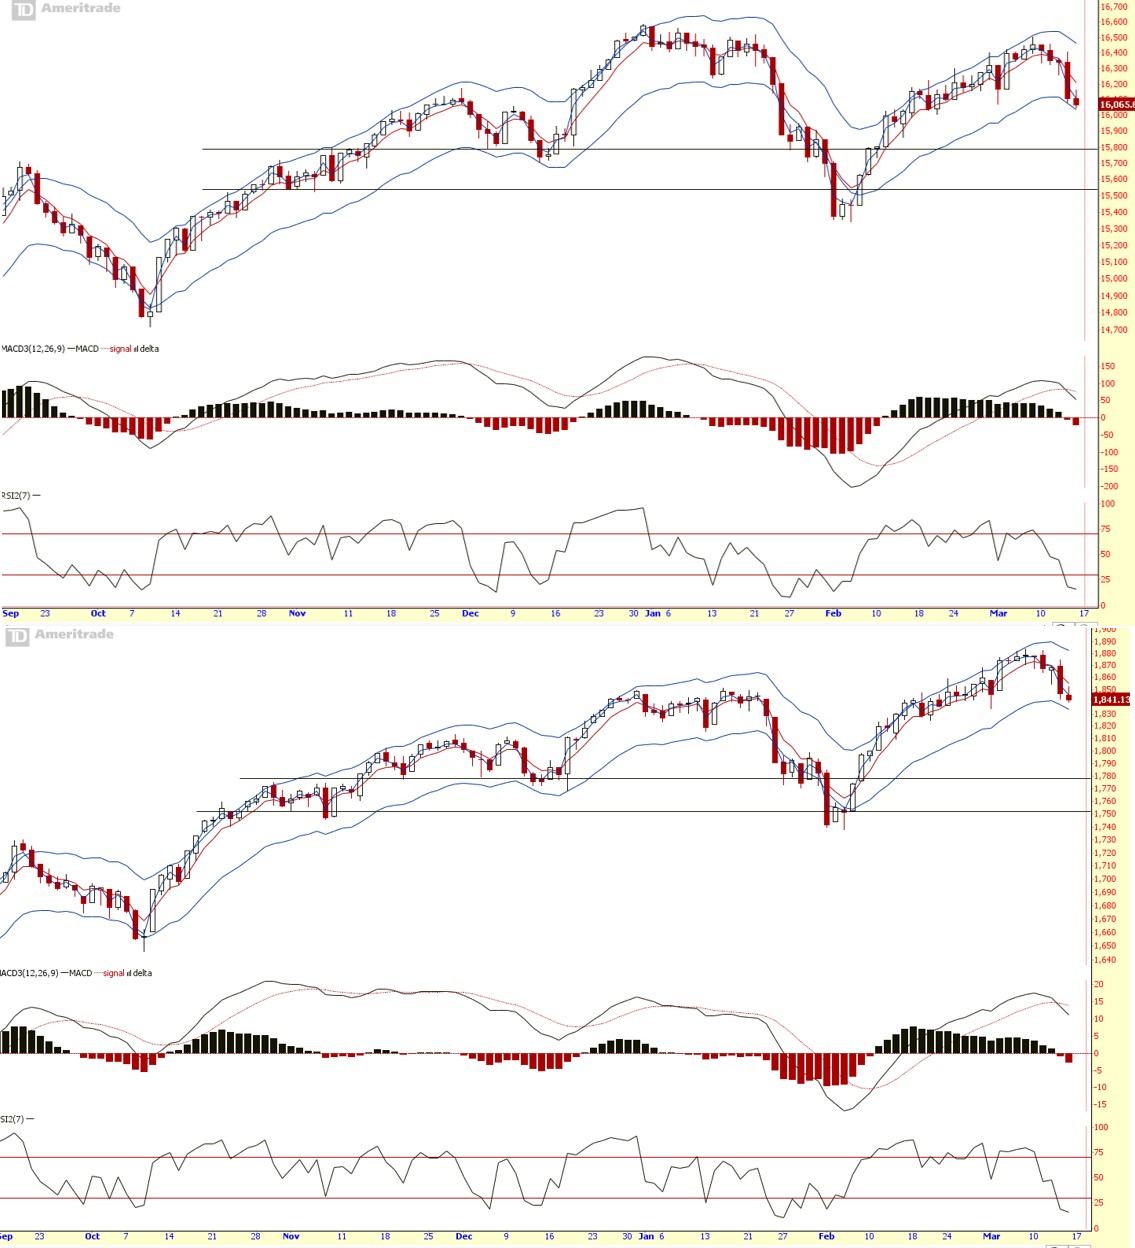
Daily chart (which helps to project the short term perspective of the market trend – as shown above) is down. RSI finally is in oversold territory. It is due for a bounce or at least a paused. If it paused, highly chances it will drop further. If it bounce but no follow through, it increases the chance that it will go lower again. If it bounce with follow through, take the ride up.
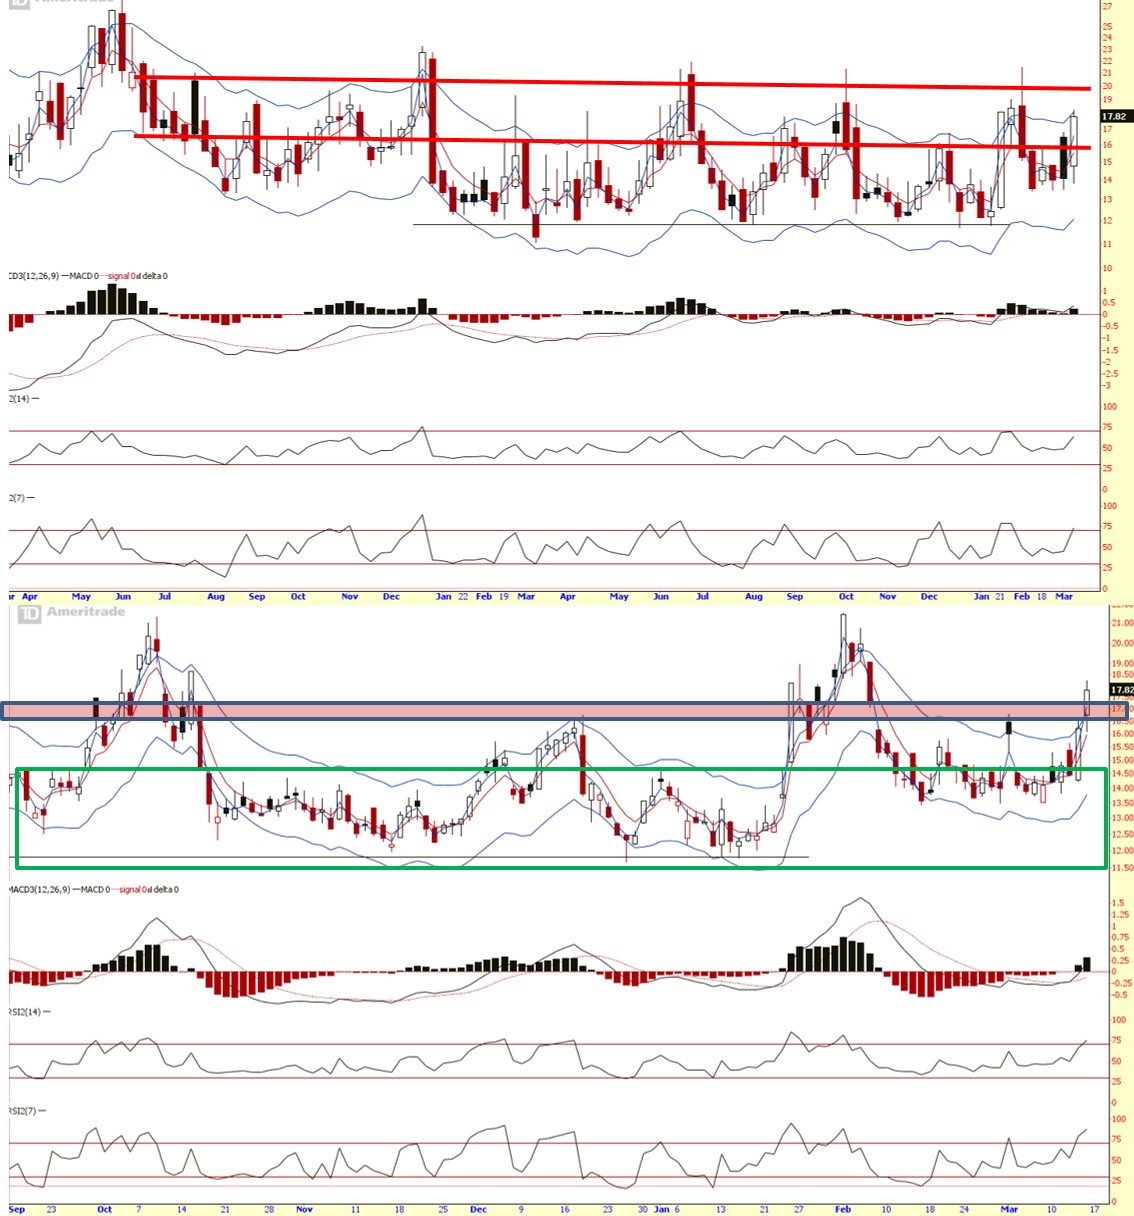
VIX (Fear index) mid-term price is up ditto daily (short term) trend. Fear is near its extreme. A pull back is near.
Summary:
Long term (monthly chart):
UP on the verge of turning
Mid term (weekly chart):
UP on the verge of turning
Short term (daily chart):
Down.
In situation like this one, what should a trader do? It depends on your preference. For me, I remember Mr Conrad, who once told me a trader must take risk. Or risk missing all market movements. The question lies when to take the risk. To me, I always find the best time to take the risk is at pivot points.
Both Monthly (long term) and Weekly (mid-term) charts are at its pivot point. And Daily (short term) chart is in oversold territory. It means the bulls are probably pressing their backs on the fence by the bears. Bulls will fight back which is why I feel a bounce is possible in the next coming trading week. But it does not mean bulls will win, although they will win eventually. Take your trade and have a stop should bulls lost the fight.
Cheers
Strongerhead ways to becoming a better trader
NOTE: All information provided “as is” for informational purposes only, not intended for trading purposes or advice.
