Market inching higher again. Gotta respect the trend because it is your friend. Pull backs should have profited for those who made fried with the trend.
It’s always good to look at things at a different perspective. Thus, I’ve shortened the monthly chart period and simplify the analysis to see it tells a different story. Plus, I’ve also included the S&P to see how the two dance in tandem for the last 80 years.
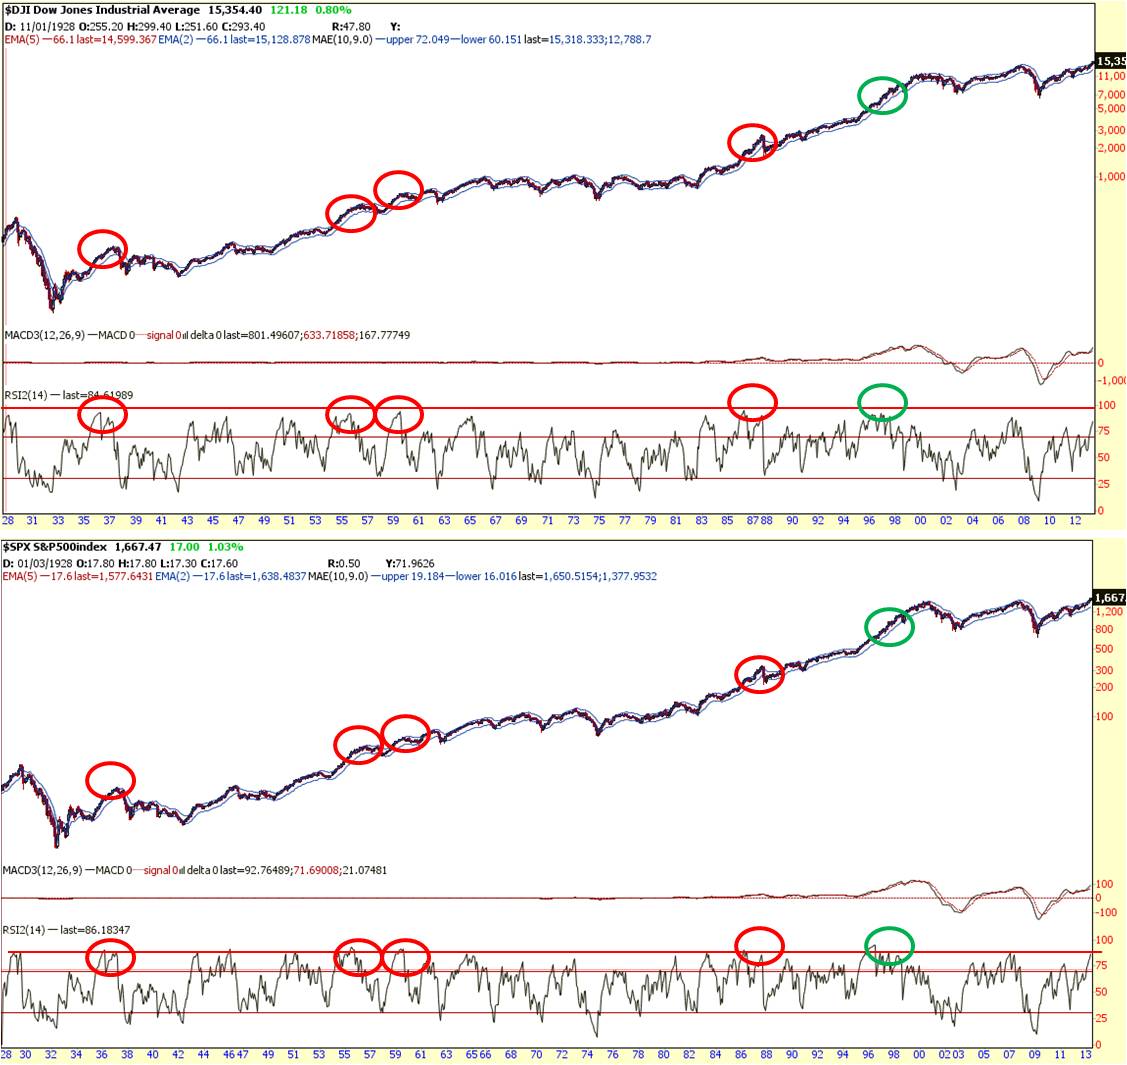
When RSI reached its extreme overbought level, prices can go up higher, but not without a pull back. It did so 4 out of 6 times. Over time, the trend is always higher. Which is why some strategies suggested being net long for the long run. If the market is going to pull back, the question is why? Let’s take a look at the nearer term patterns for some more clues.
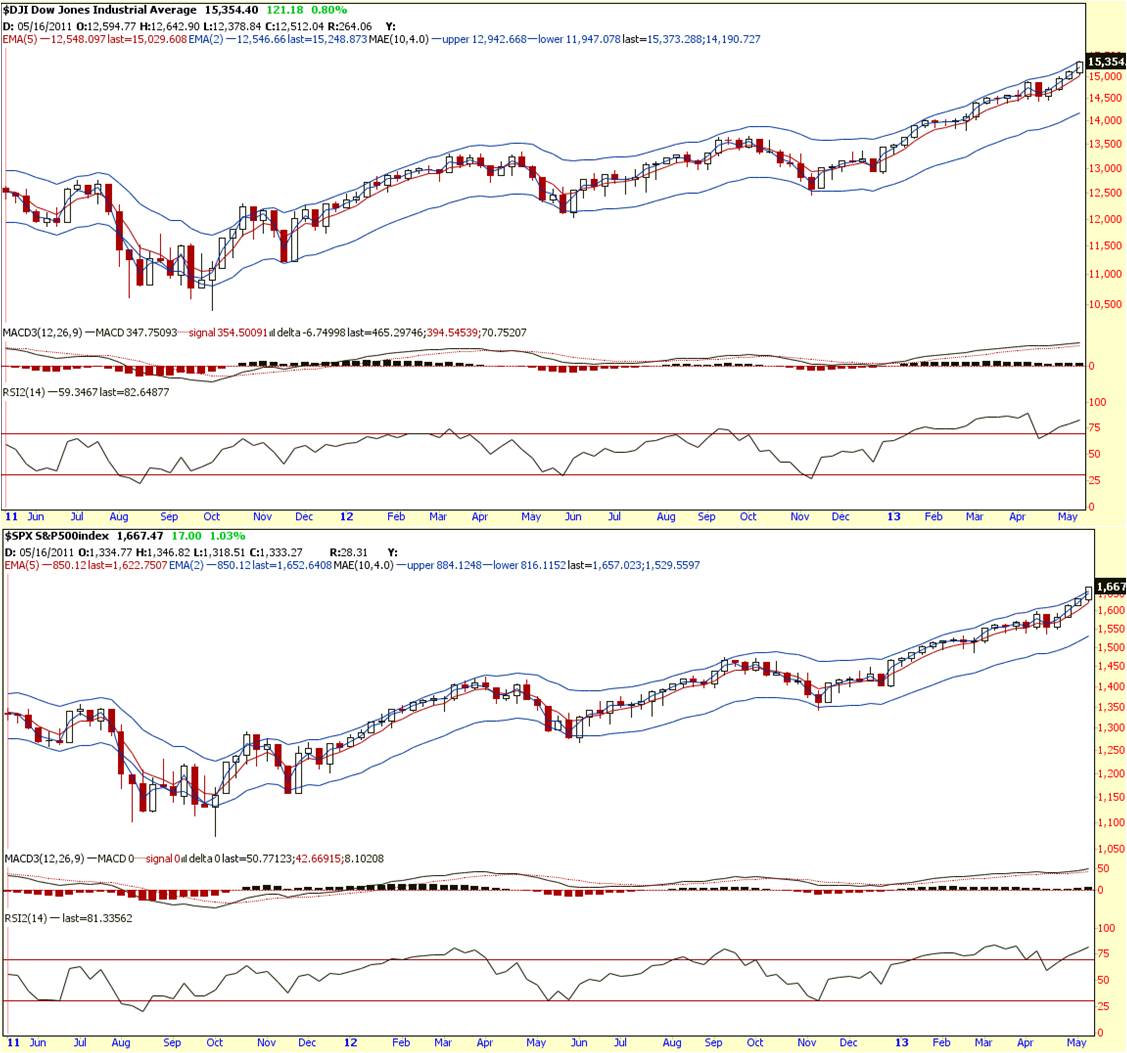
Price from the weekly chart is levitating. It is staying in its overbought zone longer than any other bull run in the last two years. No real divergence has been established yet. Except prices is now in the top of its envelop. If the bulls still have stream (which is highly possible still), prices can continue to stay overbought for some time. Peaks are always harder to catch coz greed can be limitless.
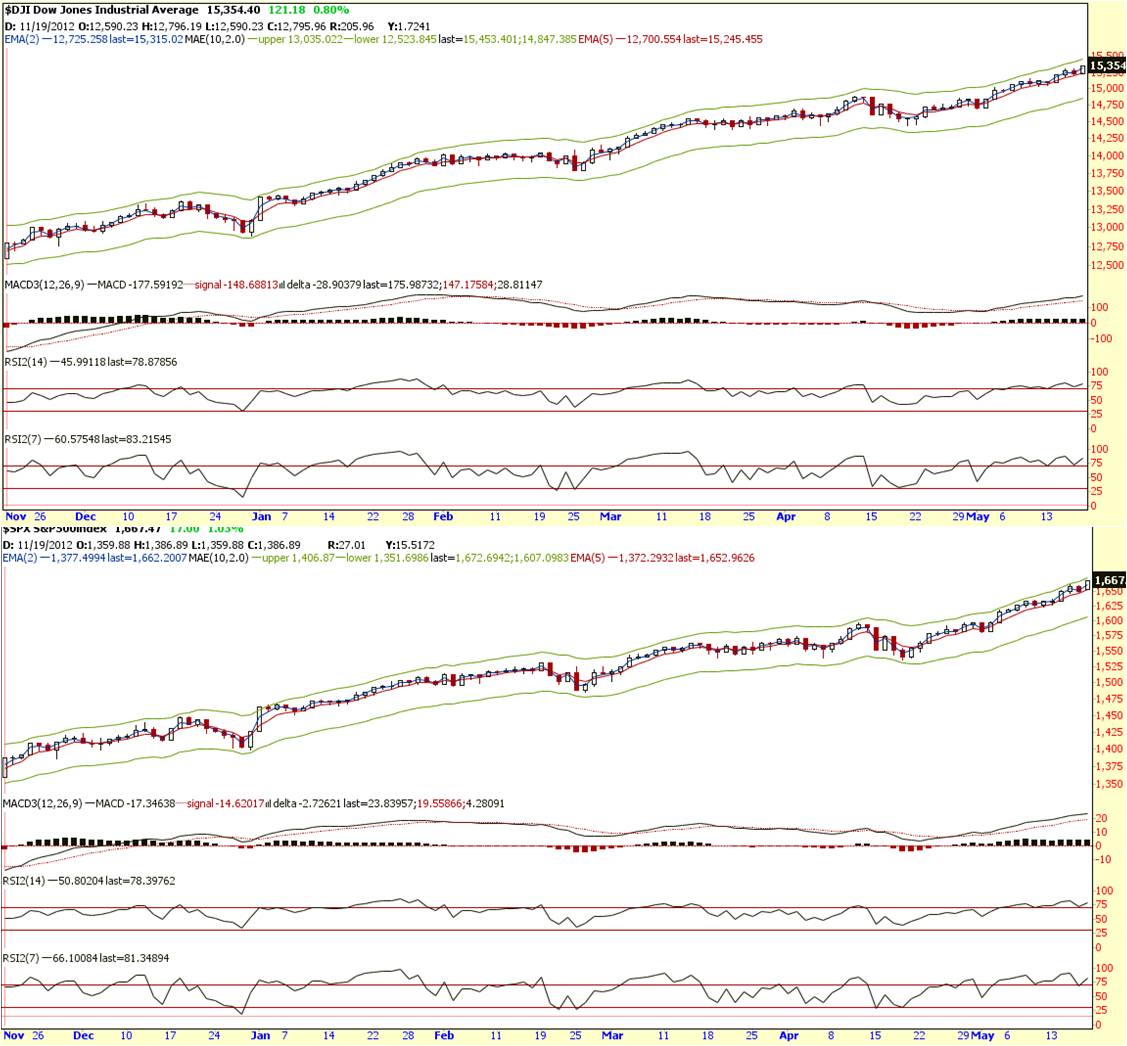
Daily chart prices suggest no real weakness in the bull trend. Except prices are also in the overbought zone.
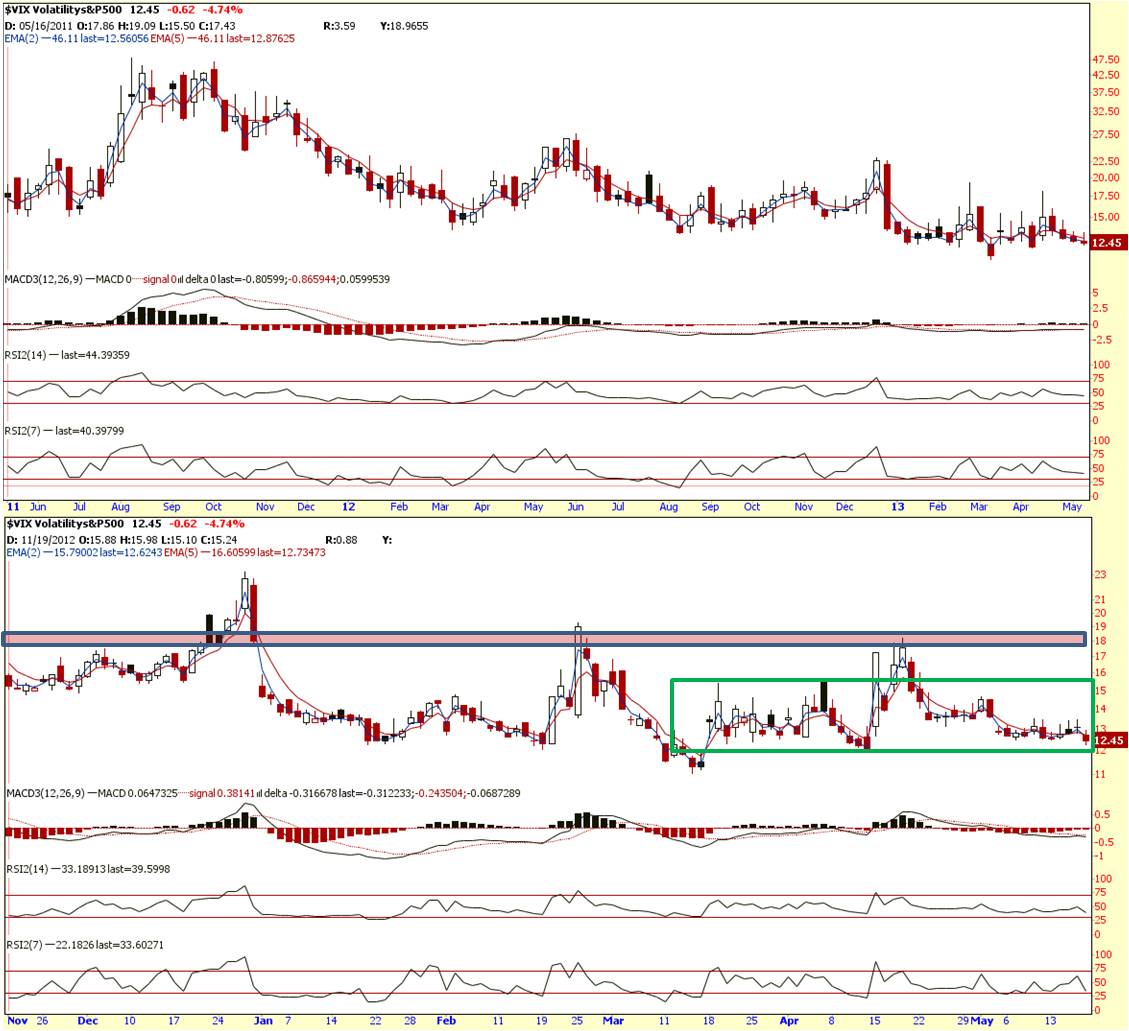
VIX (fear index) daily and weekly are lying flat, near its support zone.
Summary:
Long term view:
Trend is UP. Overbought
Mid term view:
Trend is UP. Overbought
Short term view:
Trend is UP. Overbought.
VIX is near support, not into extreme oversold zone yet. I believe VIX might retest its previous low at $11.99. Which means the market can go a little higher and there should be another dip at the very least.
Cheers
Strongerhead ways to becoming a better trader
NOTE: All information provided “as is” for informational purposes only, not intended for trading purposes or advice.
