The trend is your friend until it says otherwise. Let’s see if the sign of otherwise will happen this week?

Monthly chart (which helps project the longer term perspective of the market trend – chart as shown above), Dow is not as heated as the S&P. When RSI reached a peak, a cooling off dip tends to occur before it runs up again. It happened twice in the last one year. Before that happens, some weakness should be spotted on the weekly trend.

Weekly chart (which helps to project the mid term perspective of the market trend – as shown above) is clearly up. It can ride the edge of its envelop for around 5 weeks before any pull back.
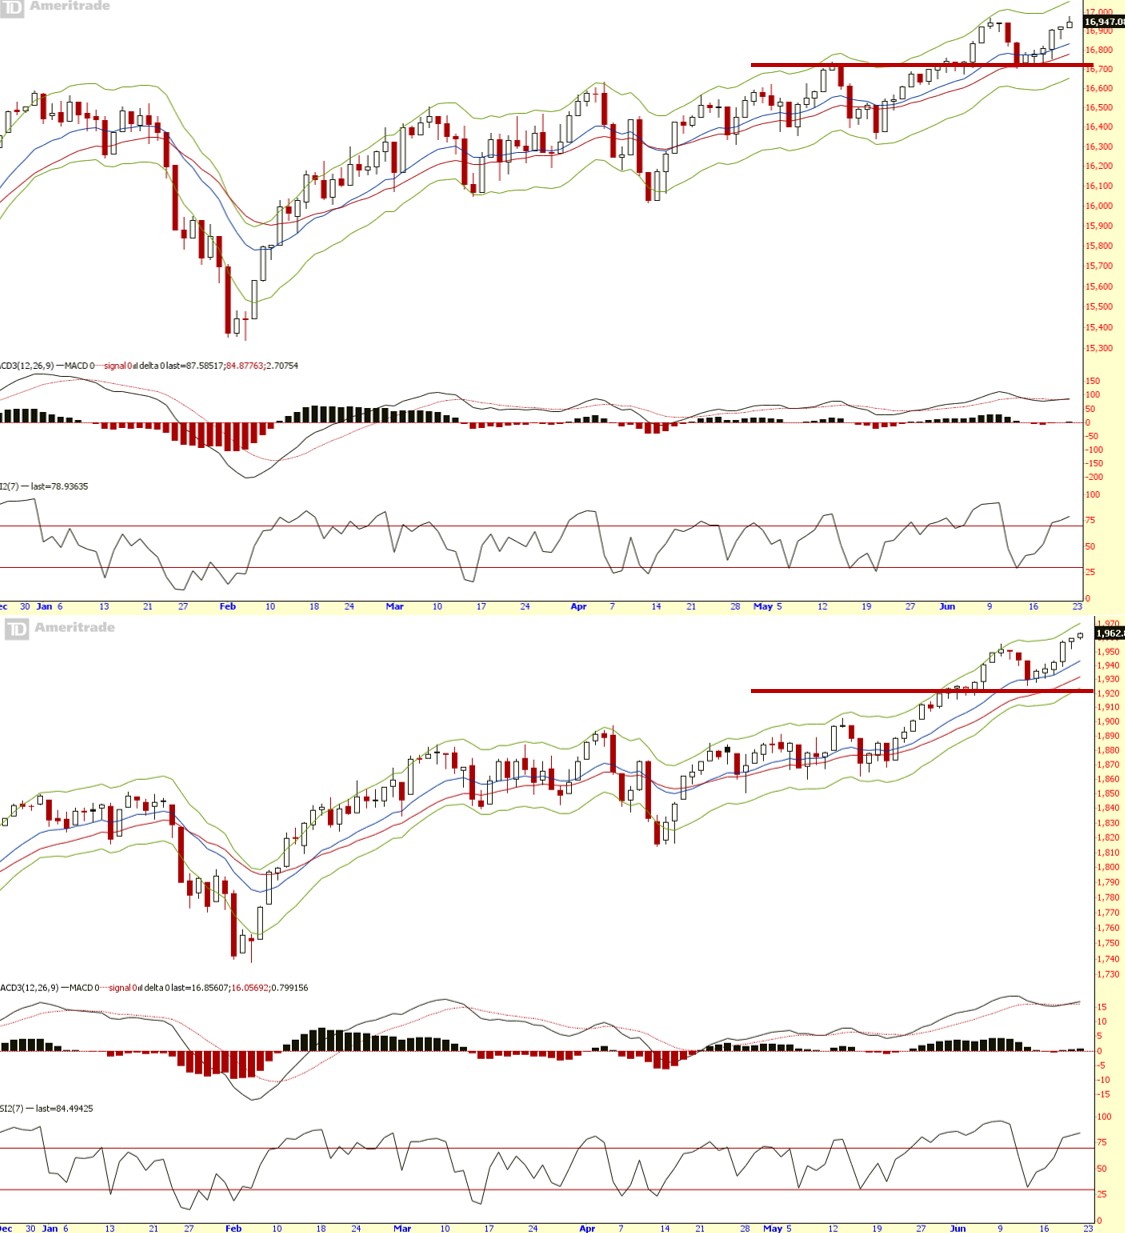
Daily chart (which helps to project the short term perspective of the market trend – as shown above) bounced off from its support as we had expected from last week’s analysis. With RSI into overbought zone, I expect to see some cooling off or dips to happen in the coming week.
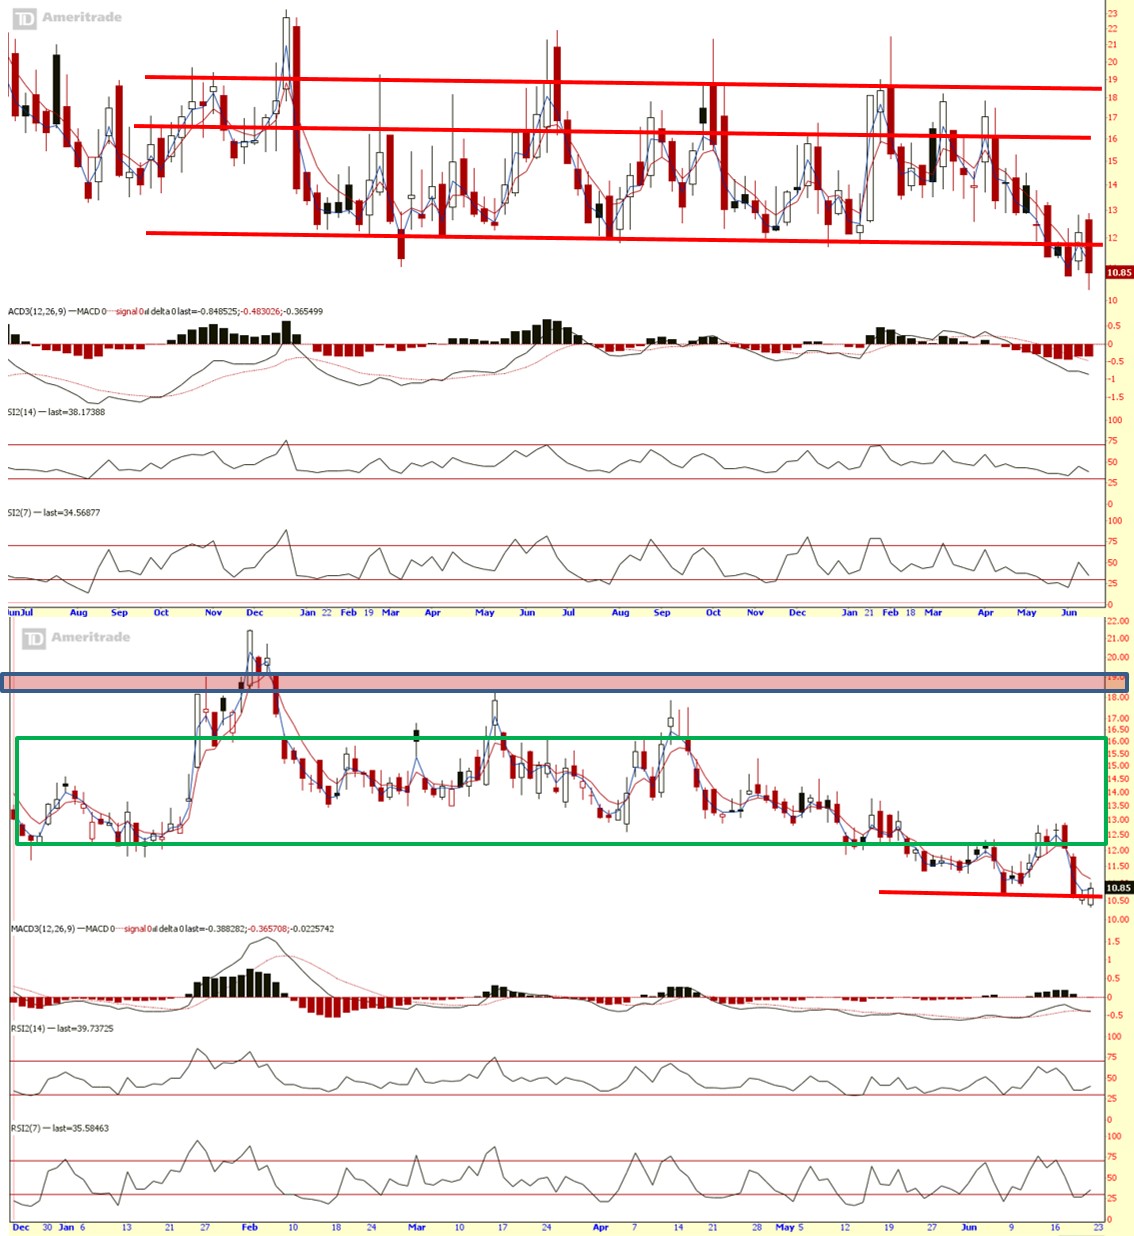
VIX (Fear index) mid-term and daily chart showed prices are quite low. Market is not fearful. As the top of the green box seems to suggest the new resistance, VIX is probably looking to build its new range of support at level not seen in the last two years with the market heading up in bullish manner.
Summary:
Long term (monthly chart):
UP
Mid term (weekly chart):
UP
Short term (daily chart):
UP
Mid Term Fear:
DOWN on its way to cross.
Short Term Fear:
DOWN
Big picture might paused to cool off from its overbought condition. A dip would only happen if VIX weekly rally back above $12. Anything below that is consider norm, with no threat to the current trend.
Cheers
Strongerhead ways to becoming a better trader
NOTE: All information provided “as is” for informational purposes only, not intended for trading purposes or advice.
