Due to my preparation for a talk at Curtin for their Pre-Graduation Ceremony, I was not able to make time for my Financial market Analysis for last trading week. This week, it came a bit late as my laptop was send for servicing. Didn’t wish to miss another week of trading homework, I’m now using other people’s laptop to perform my analysis.
Last week’s read on the market was relatively easy. But greed has gotten the better of me, caused me to forget the meaning of enough. The mentality of wanting for more as prices went to a manic state for a day, resulted in lesser profit by end of last week. Will prices continues to head south from where it ended last Friday? Let’s take a look at the charts.

The weekly chart is trending UP. But I can’t help being bearish on the last candle. That is an ugly looking candle for a bullish rally.
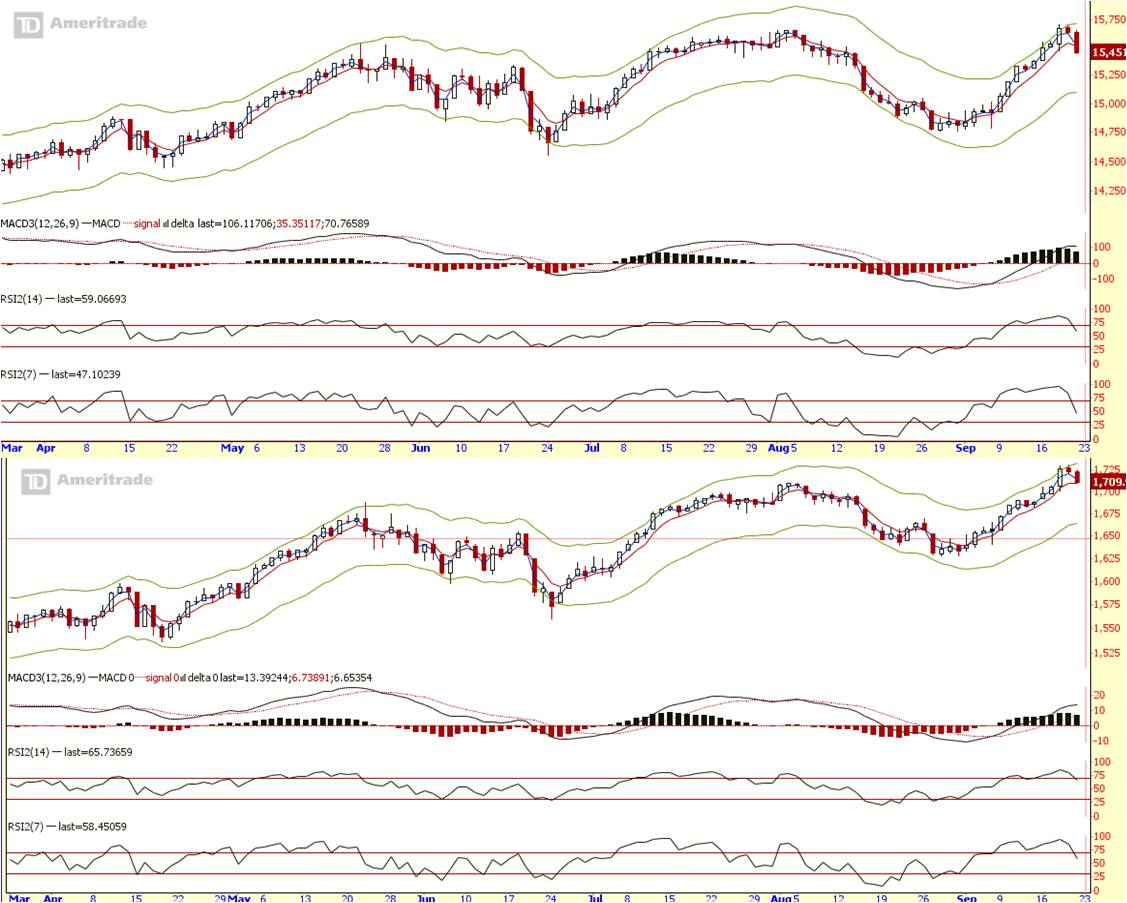
The daily chart shows prices as rejected the top of its price envelop as RSI reached overbought level.
VIX (Fear index) weekly is still trending within the two red lines, currently at lower end of its support. VIX daily is sitting at the bottom of the green box. RSI for both readings are in its oversold condition.
Summary:
Mid term view:
Weekly trend is UP.
Short term view:
Short term trend is showing a dip from the UP trend.
Prices are currently telling us that the market is still trending up. But take note of the bearish signs.
Bear sign 1: Weekly candle looks ugly. Rejected its high. Could be just a retest of previous resistance. But if resistance turns support fails to hold, we are in for trouble. Watch S&P around 1700 – 1693 to hold)
Bear sign 2: Dip in uptrend normally holds in the middle of its envelop during a minor pull back. It has reached the middle of its envelop, if it fails to hold, not a sign bulls would favour.
Bear sign 3: VIX weekly and daily is on its support level, RSI in oversold territory. VIX doesn’t stay oversold for long.
Base on the charts, I’m a skeptical Bull. Will profit take and run for cover if any of the bearish signs becoming more prevalent.
Bear sign 3 should happen first, and if it does, bear sign 1 and 2 will kick in. If support level fails to hold, profit from the fear instead.
Cheers
Strongerhead ways to becoming a better trader
NOTE: All information provided “as is” for informational purposes only, not intended for trading purposes or advice.
