Market rallied the first two opening days of the trading week into the resistance zone, and prices pulled back lower than its previous low, currently sitting slightly below its support zone.
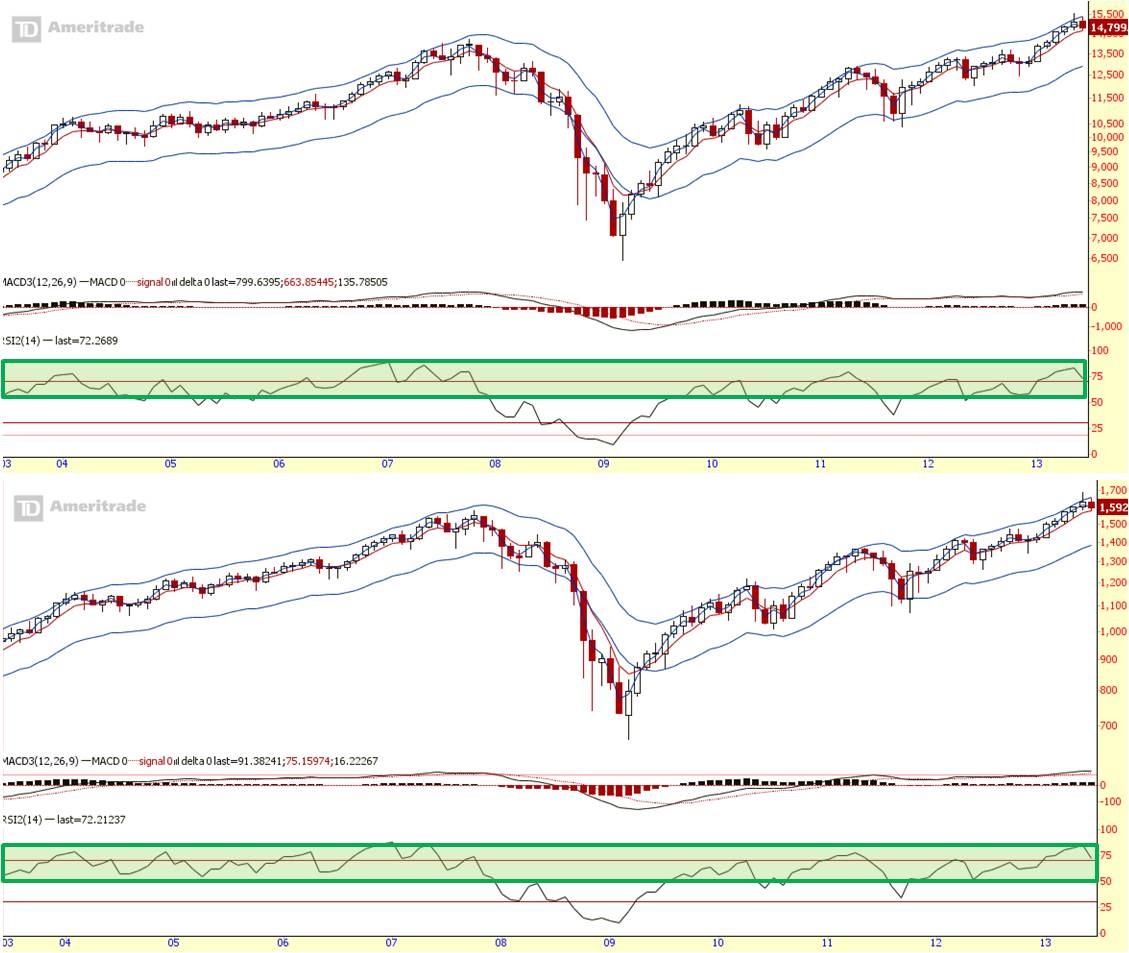
The June monthly candle is the first red candle in the last 6 months. RSI still sitting within the green zone – the market is still up in the long term.
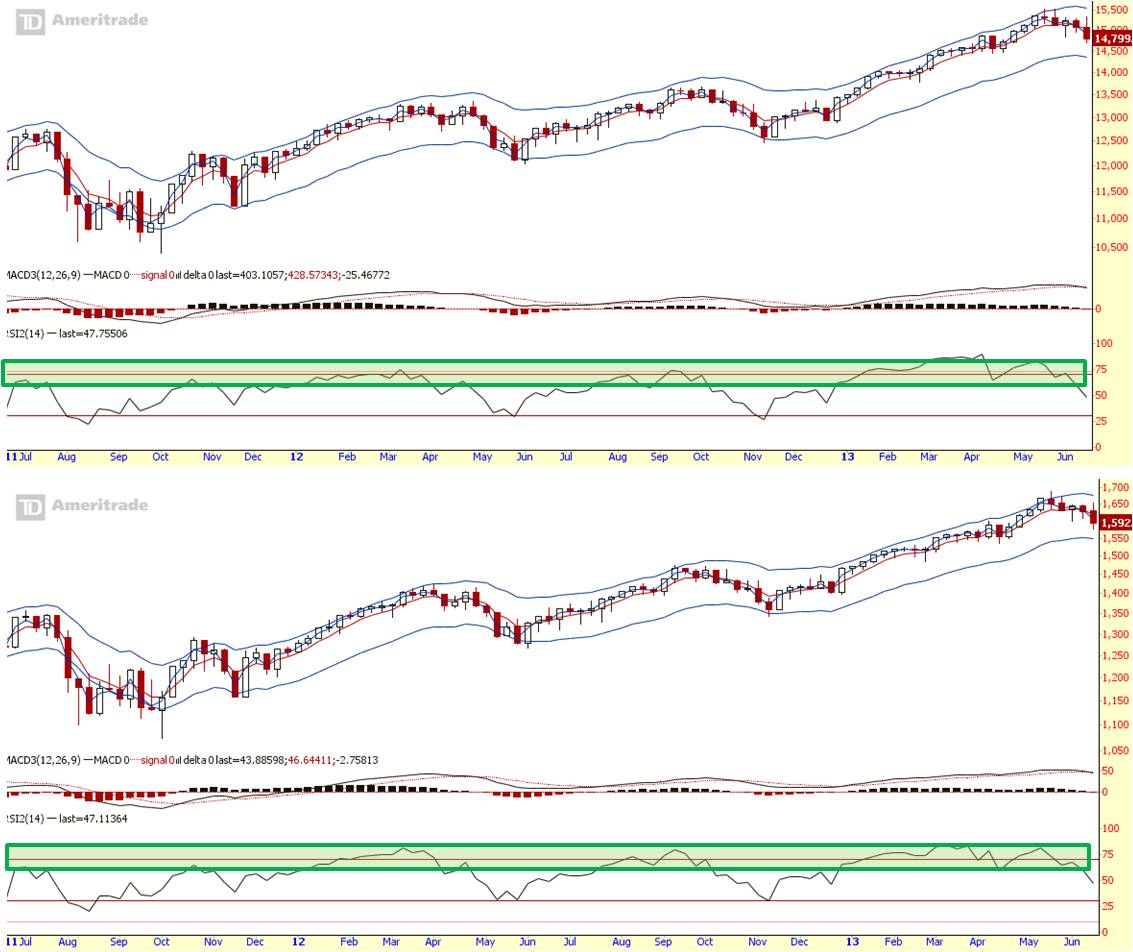
On the weekly charts, EMA and RSI suggest we are in mid-term down trend.

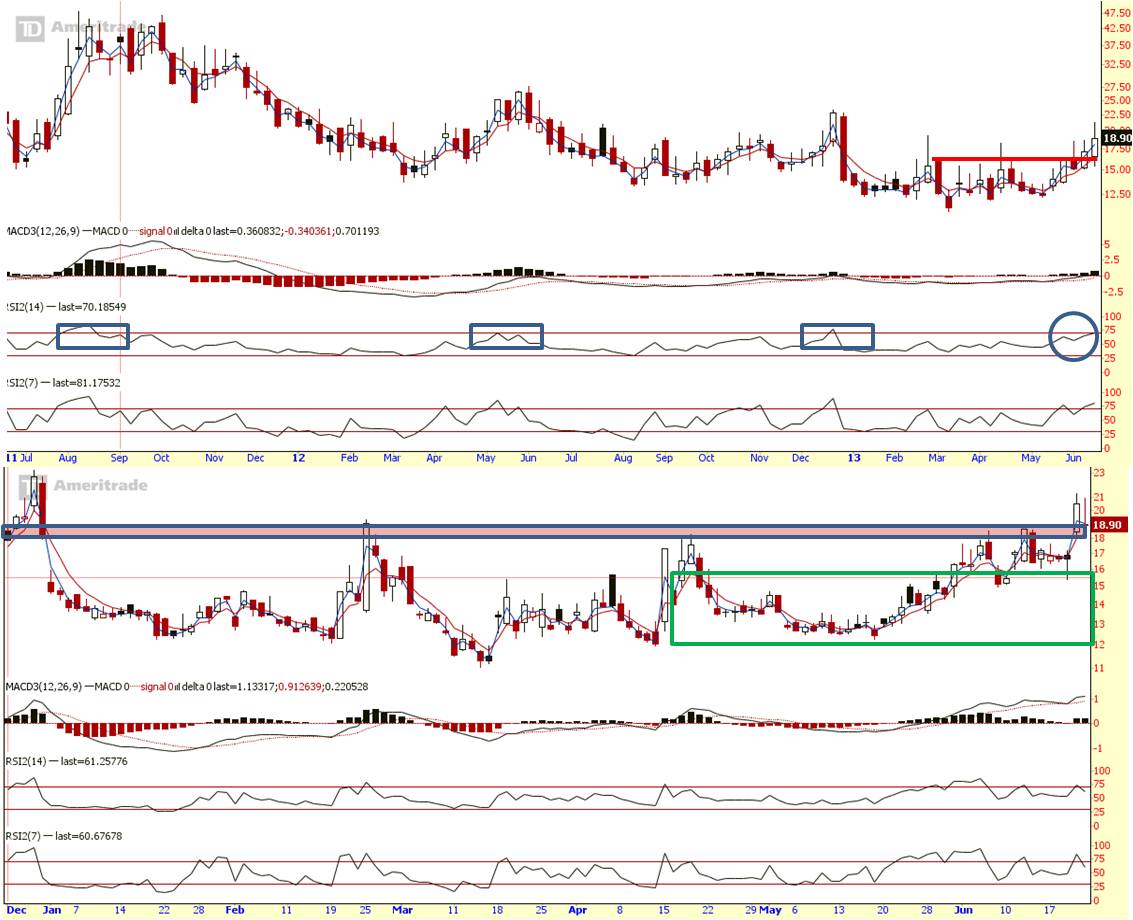
On the daily charts, prices traded within a range until Thurs, where it broke and stays below the support zone causing RSI to be in a short-term oversold condition.
VIX (fear index) weekly broke out of its resistance sending RSI into overbought zone. VIX daily chart showed that price has broken way out of the entire zone on Thurs causing RSI to be overbought. By Fri, price came back down, currently sitting near the upper end of the red zone to cool off from the overbought condition.
Summary:
Midterm view:
We are in mid-term down trend for now until the indicators showing direction has changed course.
Short term view:
We are in short term oversold condition, which means possible rally can continue after Friday’s paused from going lower. In view of the mid term direction, any rallies would have to be considered a bounce from the down trend. In a down trend, most supports will fail to hold, and resistance will turn support. Thus, there’s a high chance Dow support will turn resistance, and VIX’s resistance will turn support.
When bears are in control, be on the short side. Or stand aside and have your shopping list ready. Bears do not take charge for long.
Cheers
Strongerhead ways to becoming a better trader
NOTE: All information provided “as is” for informational purposes only, not intended for trading purposes or advice.
