We expected the bulls to fight back base on our 17 Mar report. And the market for the week of 17 Mar closed above 1%. I’ve no crystal ball nor guru. Just a good guess made base on market analytical knowledge that I had learned from Conrad Alvin Lim and Dr Alexander Elder.
First off, I must congratulate my mentor Conrad Alvin Lim on his new book launch “Winning Psychology of Defensive Trader”. Read more at http://www.conradalvinlim.com/2014/03/21-march-2014-book-launch/ . It is my regret for not being able to witness the book launch event on Friday 21 Mar due to my lecturing commitment at Curtin. I’m definitely going to get the book. It should be available at Kinokuniya and popular book stores soon. If you are a trader in a making or trader seeking for trading ideas and improvement on trading psychology, this book is definitely a must have.
Let’s come back to our market analysis for the week of 24 Mar 2014 outlook.
Monthly chart (which helps project the longer term perspective of the market trend – chart not shown this week) price action is looking tight. But it has turned from bearish to bullish price action for S&P (Dow still slightly in the red). RSI has rallied off the support line I have drawn on the monthly chart (refer to last week’s chart http://strongerhead.com/strongerhead-weekly-financial-market-analysis-17-mar-2014/ for reference). One more week to go before the monthly outlook of Mar complete itself. Let’s take a look at the weekly and daily outlook for insights into what would be the possible outcome?
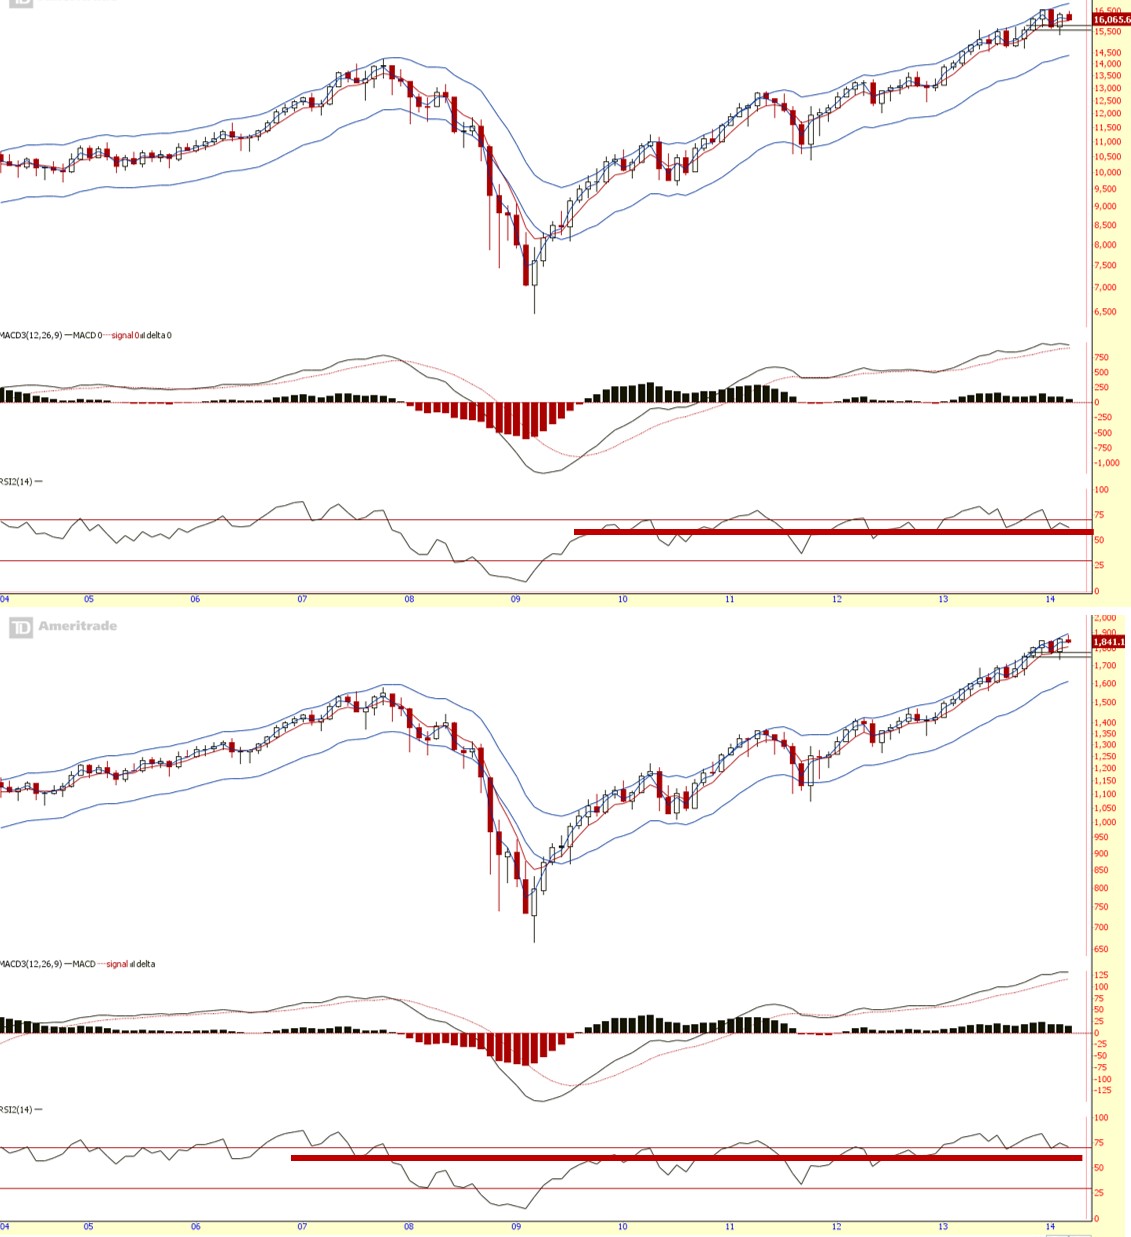
Weekly chart (which helps to project the mid term perspective of the market trend – as shown above) is in bullish mode. It did rallied, confirming our speculations since it had done so in the last 3 price behaviour (Refer to last week’s report for reference). Currently, MACDH Div is slowly fading away after missing its right shoulder. But should it tick down again, it is not a good sign for the bulls. The tail formed on the candle stick looks like a bearish sign. To avoid bears from wining, the bulls must pierce through the resistance horizontal red line I’ve drawn on the price charts. Will it? Let’s take a look at the daily chart for clues.
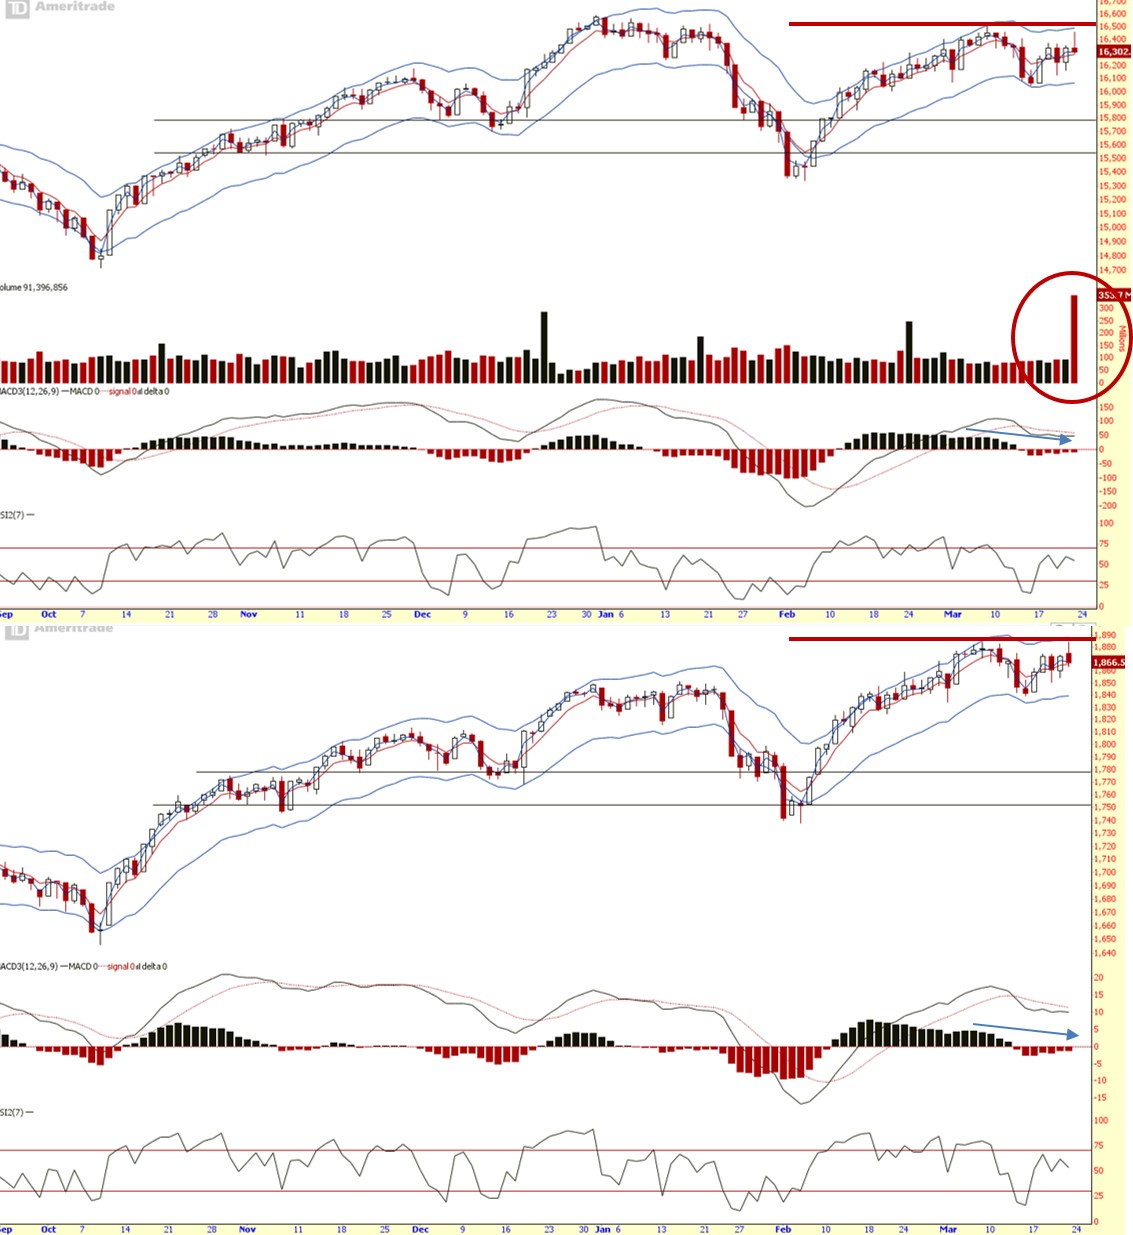
Daily chart (which helps to project the short term perspective of the market trend – as shown above) closed in an ugly mode. Especially the Dow, the long tail suggest the market doesn’t like the price at the resistance zone. Check out the volume! It suggest a lot of trades exchanged hands on Friday between the bulls and the bears. With ease of movement downwards at high volume, not a good sign for the bulls in the short term. In the last 2 years (chart not presented here), whenever volume reaches a peak with ease of downward price movement, price tends to move lower in the days ahead (it has happened 3 times in last 2 years).
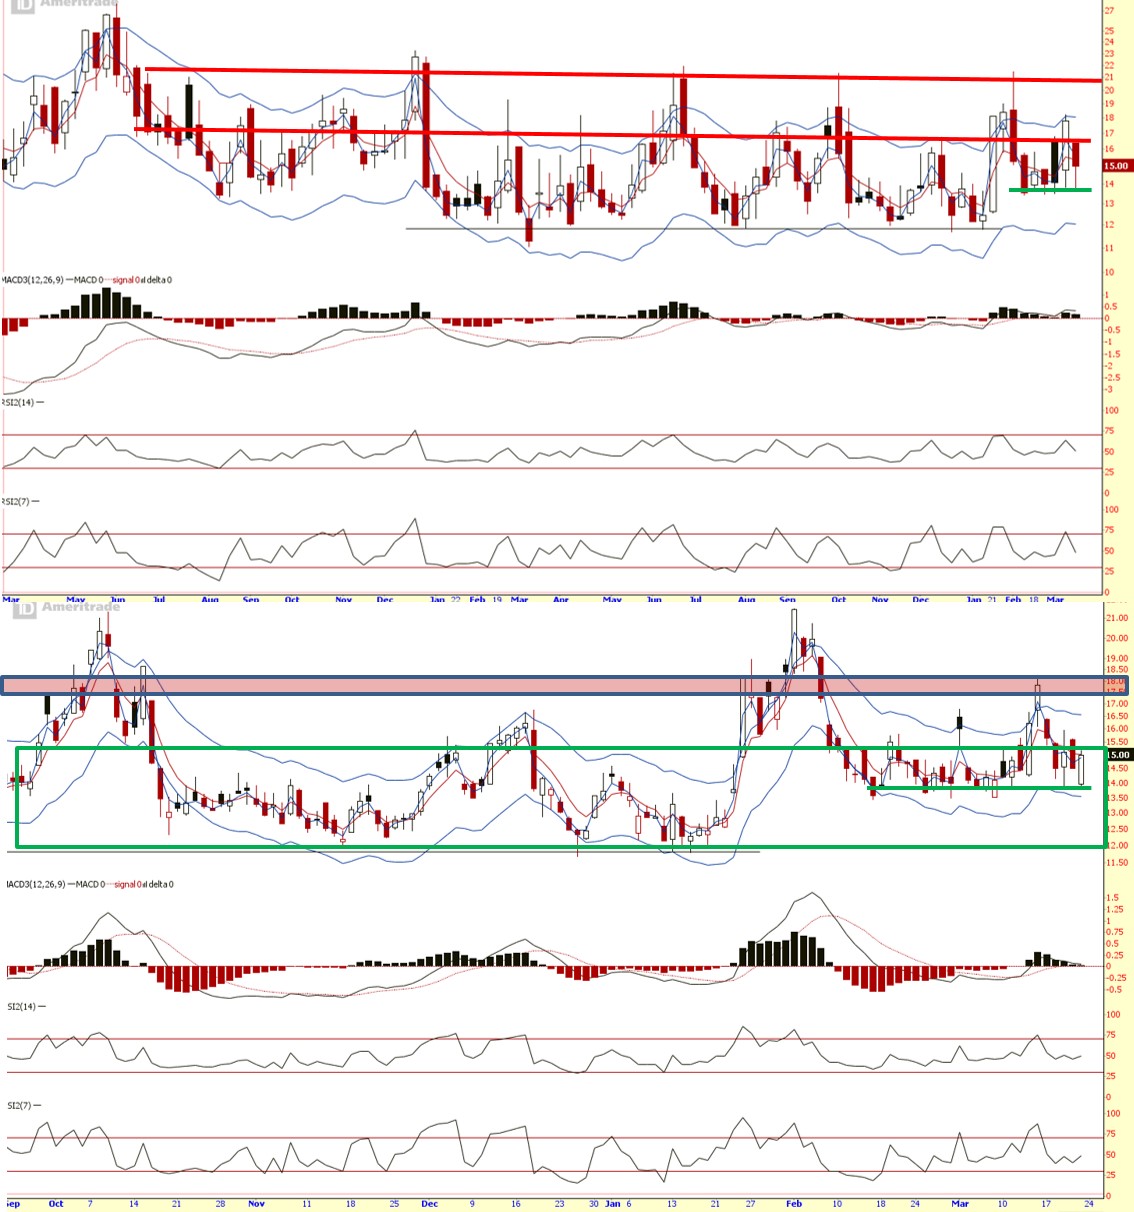
VIX (Fear index) mid-term and short term price did pull back cooling off last’s week overbought condition. But looks like they have found support on the short horizontal line drawn on both weekly and daily price charts, capable of rallying up again.
Summary
Long term (monthly chart):
UP but flat (can change tide anytime still)
Mid term (weekly chart):
UP but flat (can change tide anytime still)
Short term (daily chart):
UP but closed ugly on Friday
I suggest time to close off your longs you had opened last week if you have not done so last Friday. Be sure to protect your profits. Yes, anything can happen in the coming week, but right now, in the short term, bears looking dangerous.
Cheers
Strongerhead ways to becoming a better trader
NOTE: All information provided “as is” for informational purposes only, not intended for trading purposes or advice.
