The pull back did happened last week as anticipated. Is this the start of a reversal? Let’s see what the chart has to say.
We are a few days away from month end, and looks like May is going to close on a positive note on the monthly chart (not shown here). RSI is still at overbought zone.
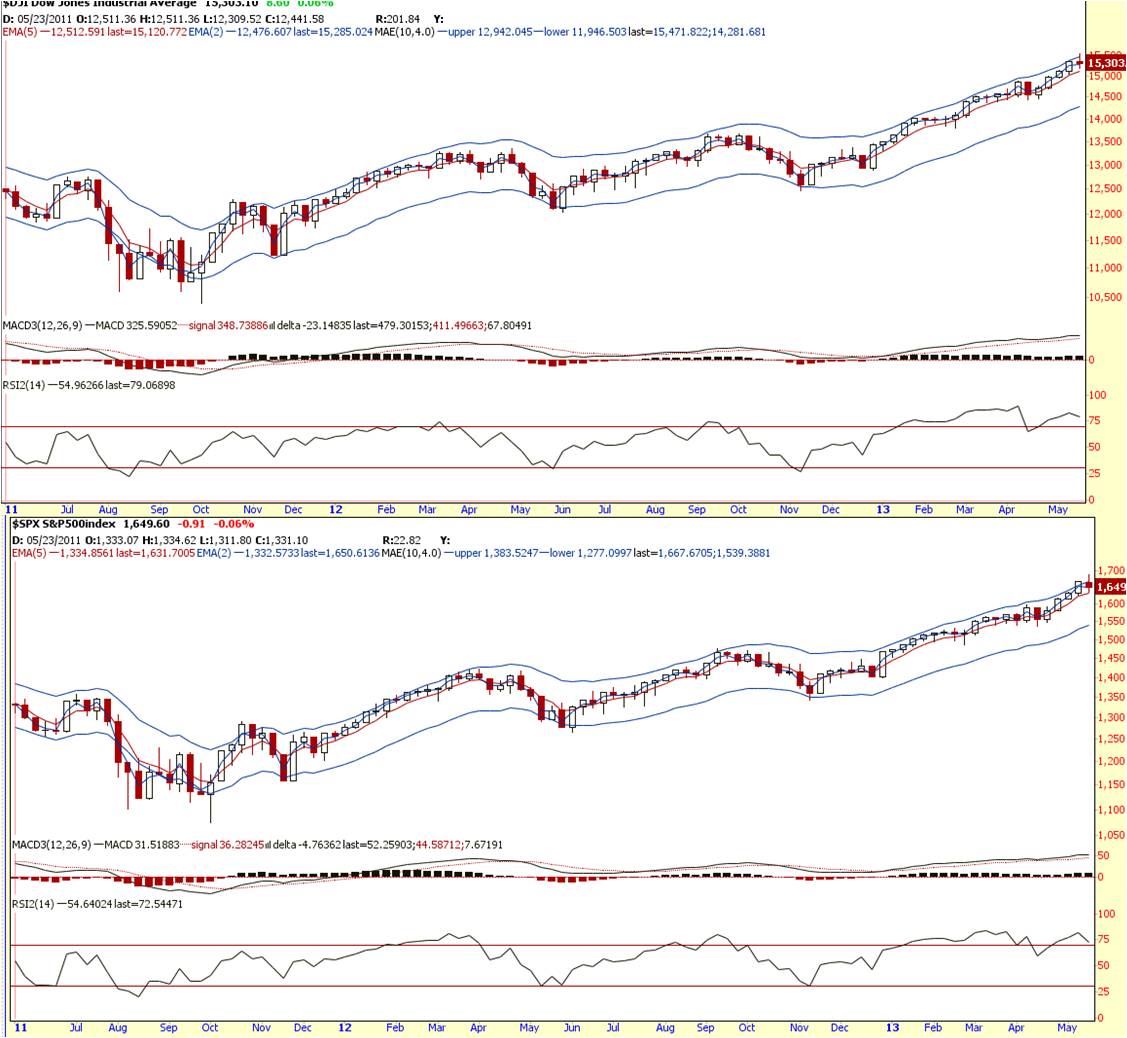
On the weekly, last week closing price is in the red. Trend is still up. RSI is also at its overbought zone, but on its lower ends of overbought (which might serve as support). Let’s take a look at the daily chart for more clues.

Dow is flat on daily, but S&P is on short term down trend. If the weekly trend do not change its course, a dip in the daily towards the bottom of its envelop causing RSI to be oversold would be a great buying opportunity. It does so three times in the last 6 months. Let’s see what the VIX (dear index) have to say.

VIX (fear index) weekly and daily prices are both sitting on its resistance zone. Based on the patterns I am seeing, whenever VIX RSI weekly reached neutral and daily VIX reached overbought, it pulls right back.
Summary:
Mid term view:
Trend is UP.
Short term view:
Trend is down. VIX is at resistance level.
The bulls are ready to fight back. Daily could dip further still until it is nearer to the bottom of its envelop.
I would hit the exit button and reassess my stand again if EMA on weekly crossed, and VIX resistance level does not hold.
Cheers
Strongerhead ways to becoming a better trader
NOTE: All information provided “as is” for informational purposes only, not intended for trading purposes or advice.
