Last week I was both wrong and right. It went down, and came back up. If you had not been greedy, you could have profited from both sides. This coming week, let’s take a look at the strengths of bulls and bears for some insights.
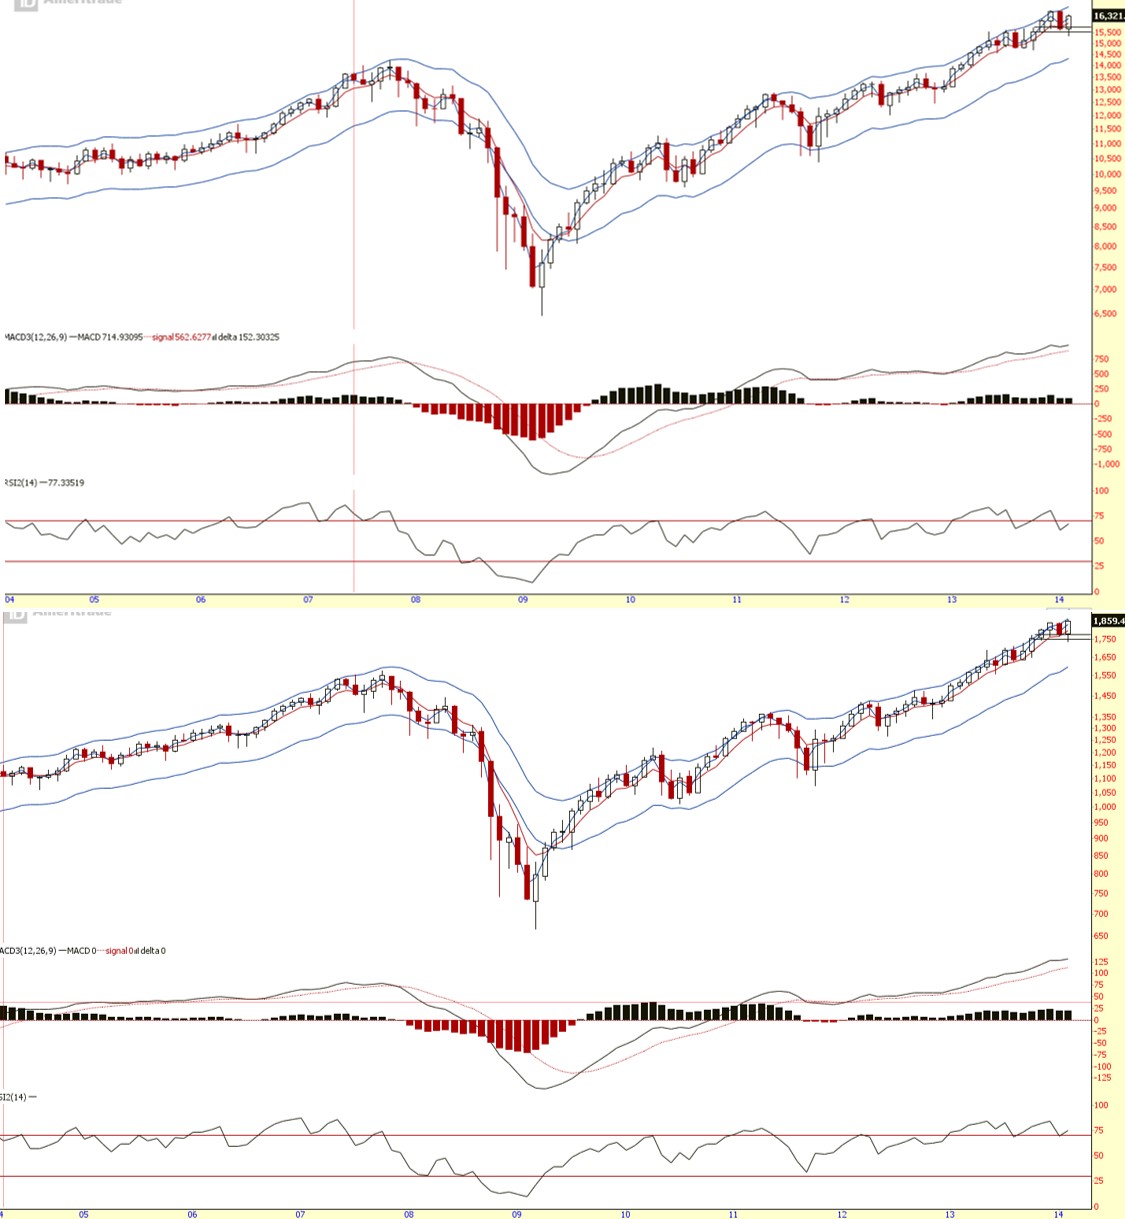
Feb 2014 closed bullishly, rewarded all those who had trusted the Bull Run and bought the dip. Monthly chart (which helps project the longer term perspective of the market trend – as shown above) is up. S&P ran up further than the Dow. But both RSI showing room for more up-run before the party gets too rowdy.
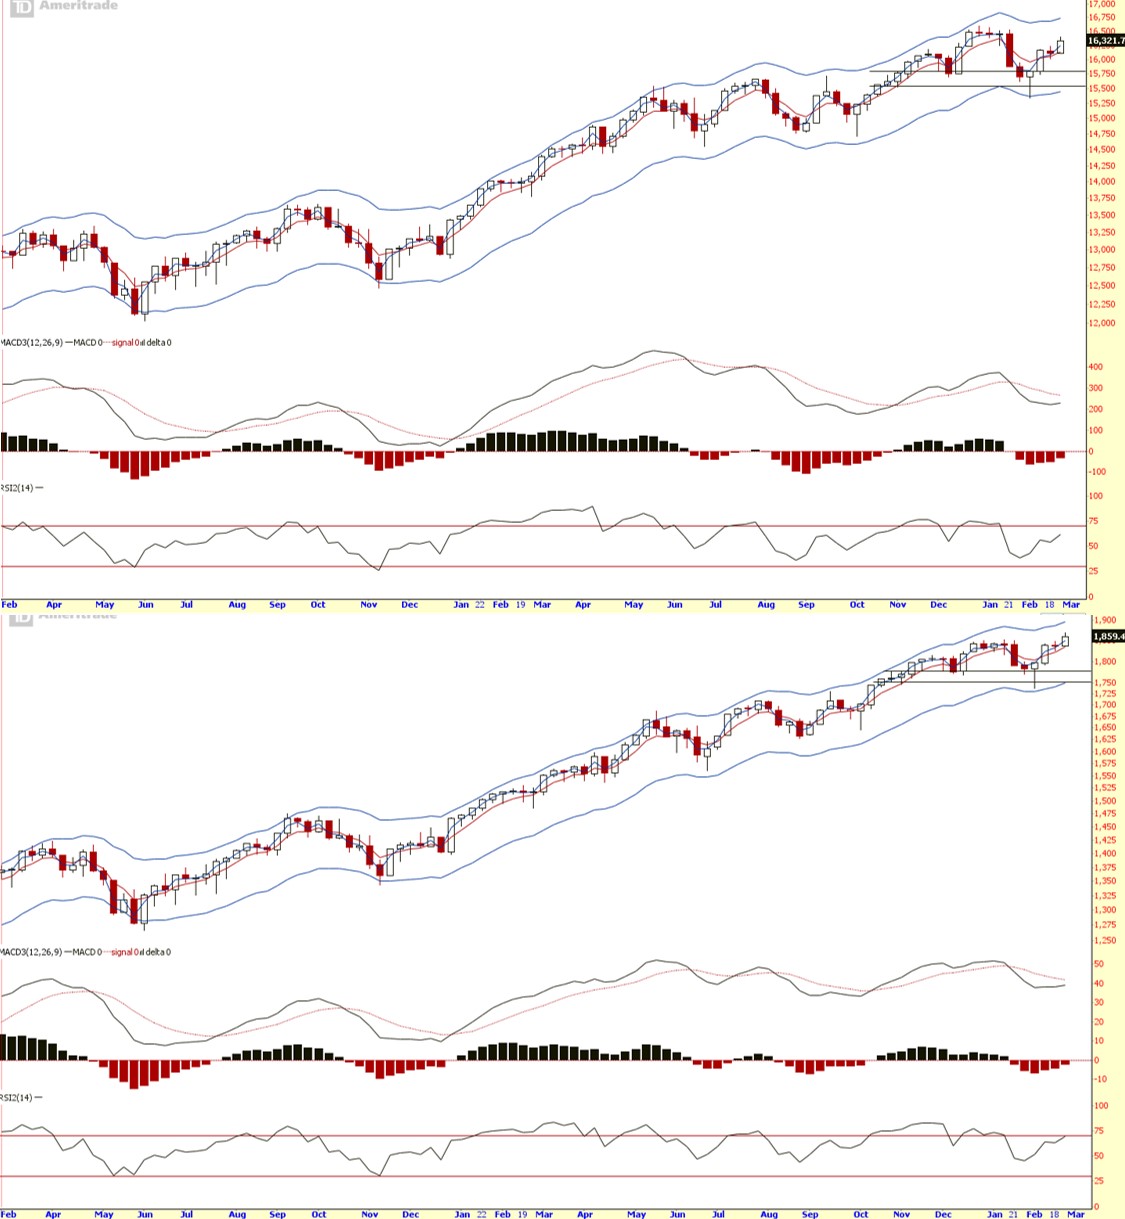
Weekly chart (which helps to project the mid term perspective of the market trend – as shown above) is up. If bulls are to continue its push, based on RSI and price envelop, there’s till room for it to go further. But I can’t help spotting a potential divergence based on MACD Histogram. No divergence yet. Just be wary.
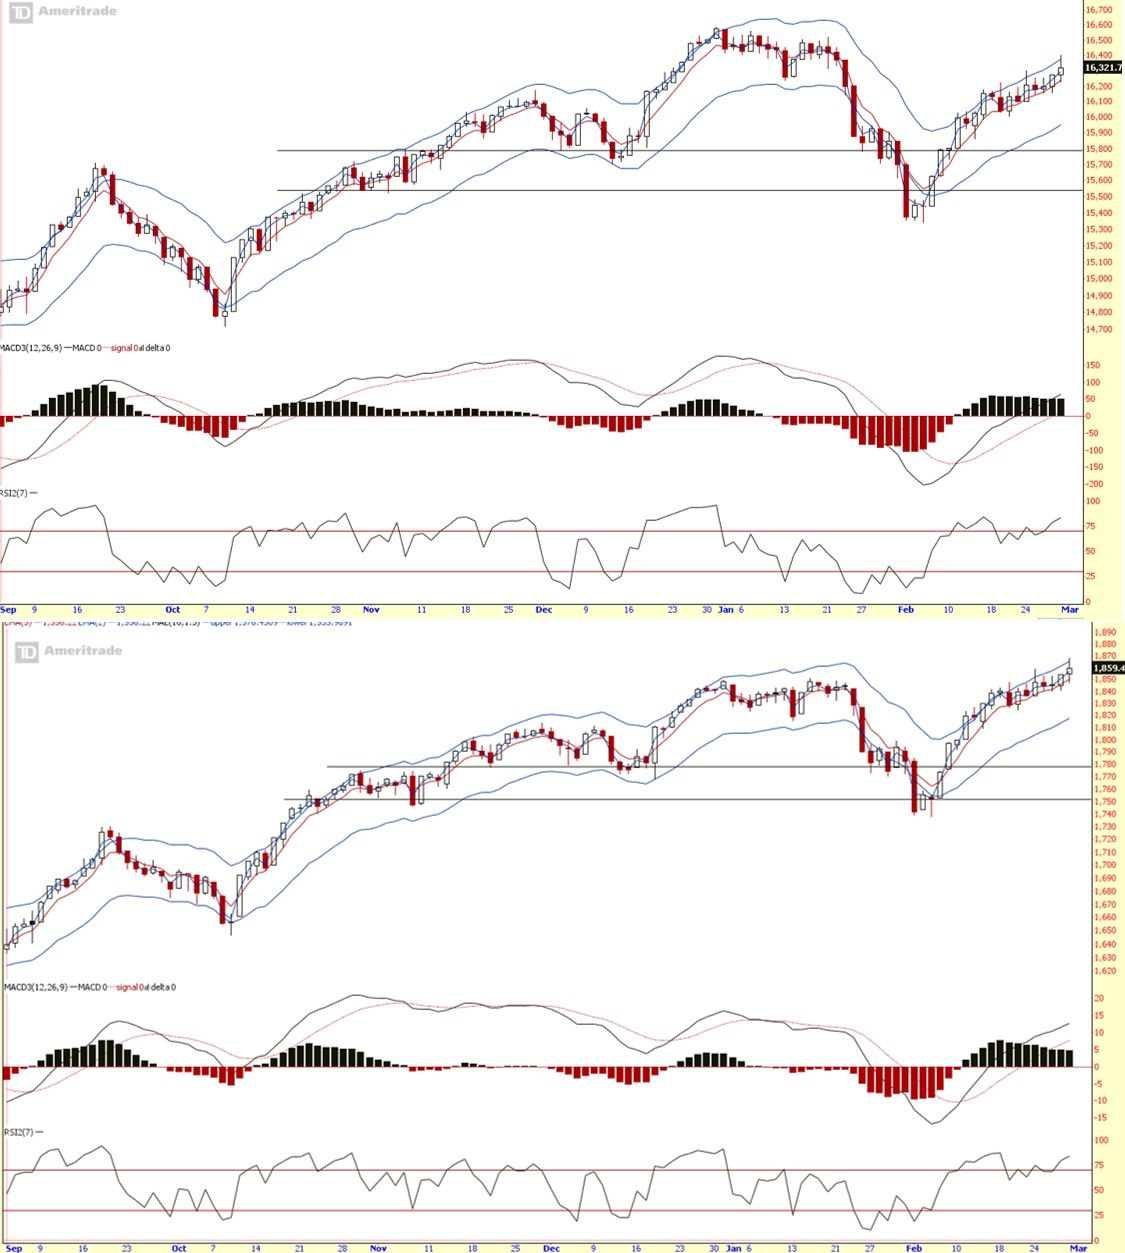
Daily chart (which helps to project the short term perspective of the market trend – as shown above) pulls back in the beginning of last trading week and tested another new high. Currently still up but a bit in overheated zone.
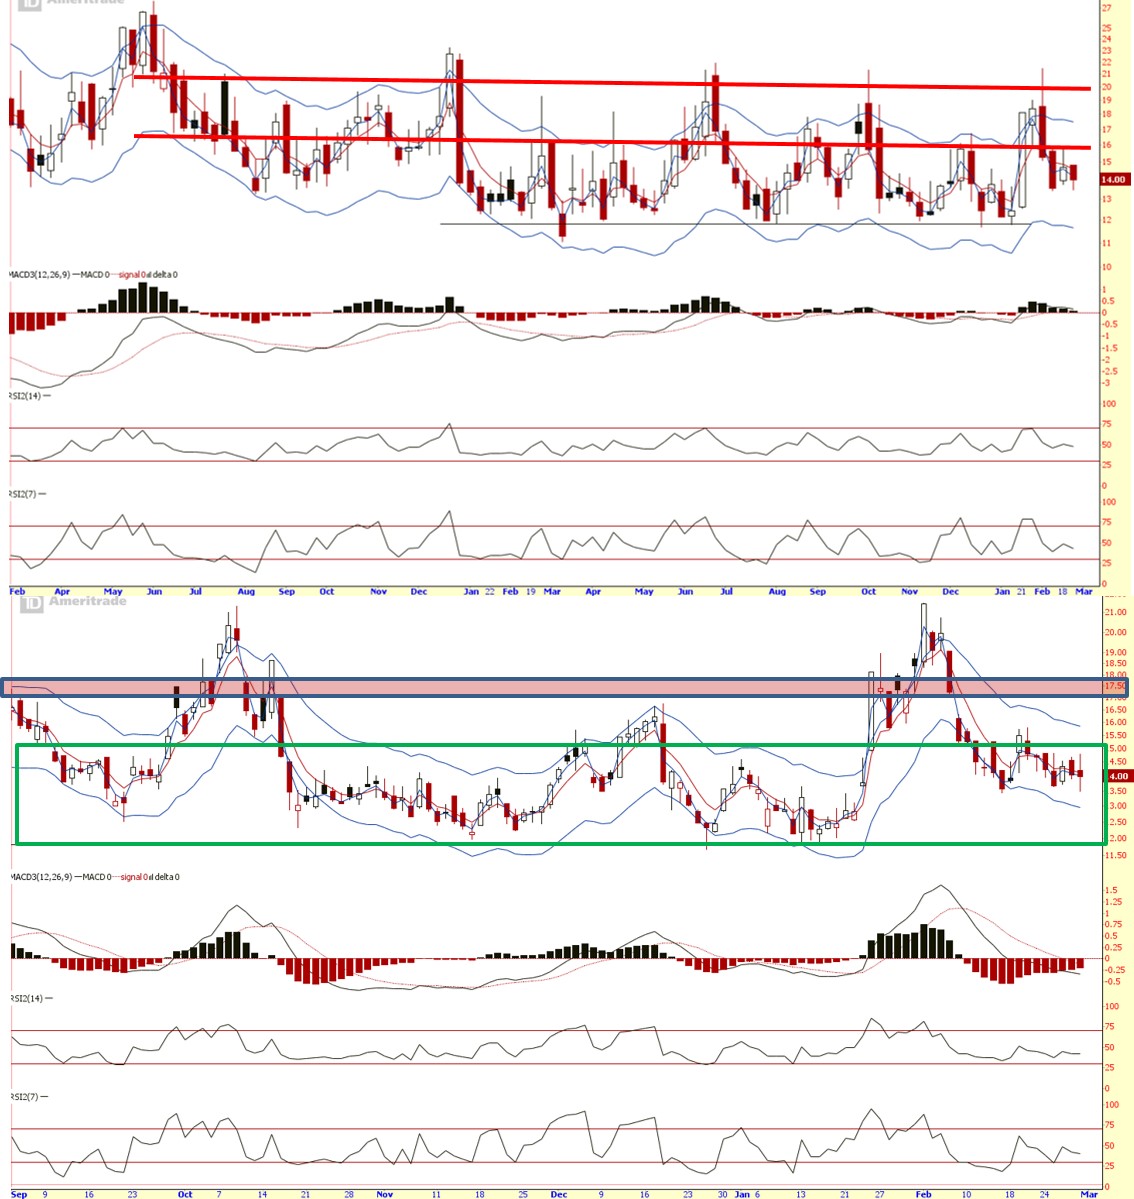
VIX (Fear index) mid-term price still sitting in the middle of its range. Ditto VIX Short term price which now also sitting in the middle of its range.
Summary:
Long term (monthly chart):
UP
Mid term (weekly chart):
UP
Short term (daily chart):
UP
Short term is a bit overheated. Long only when it pulls back. Short only when VIX are desperate. So what’s now? We wait for market to make its move first, so we can make our moves.
Cheers
Strongerhead ways to becoming a better trader
NOTE: All information provided “as is” for informational purposes only, not intended for trading purposes or advice.
