We saw a dip and the dip came. Overbought condition cooled off slightly after the dip. So what’s next? Here’s the trading homework to study next week’s possible outlook.

November was greeted by the bulls. On the monthly chart, Nov price bar is positive. But bear in mind, this is only the very beginning of the month. The price bar is considered at infant stage. On the monthly outlook, the trend is still UP. Apart from the obvious, here’s something to note:
1) Dow is moving in tandem as S&P, but it is moving slower than S&P. Usually when that happen, the market continues to move higher until both are in sync.
2) When RSI reached a peak level (indicated by the horizontal green line), it’s a sign of strength by the bulls. Which means there’s a higher possibility the trend will go higher.
3) When RSI reached a peak level (indicated by the horizontal green line), and prices reached the top of its channel, it also mean a possibility of a dip pull back is near. And after such pull backs, prices will tend to reach a new high.
4) When RSI reached a peak within a short period, prices testing the top of its channel again within a short period but not breaking resistance level, it is a sign of climatic behaviour (trend is tired).
For Monthly outlook to dip, weekly outlook must show weakness first.
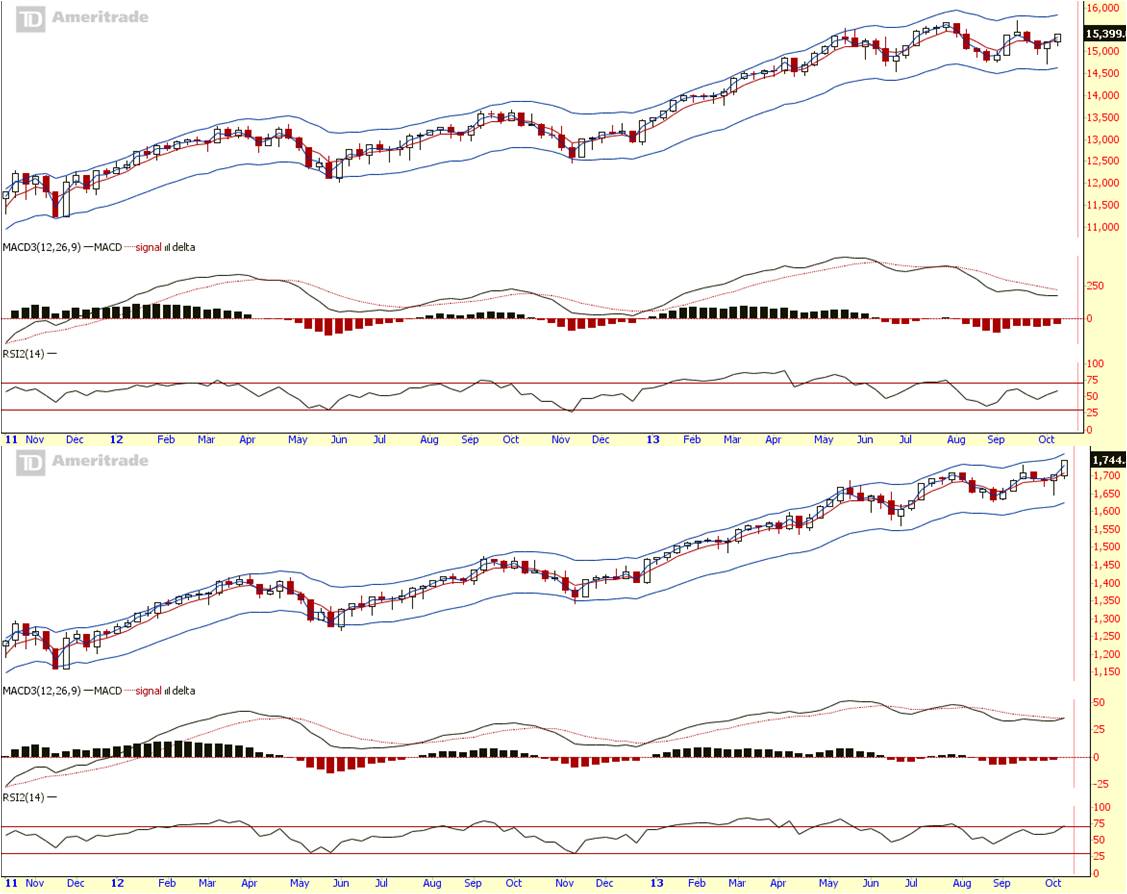
On the weekly, S&P broke out of resistance, Dow currently at resistance level. RSI suggest S&P is heating up faster than Dow. If the pattern is to repeat again (as mentioned in Monthly outlook above), S&P will wait for Dow to catch up. Let’s see if Daily chart gives any sign of confirmation on this.

On the daily, both Dow and S&P have cooled off from its overbought. As discussed last week, price can go nowhere for a month as it has done that during Jul-Aug. I’ll use the horizontal line and top of the price envelop as my range. Prices must break resistance level for weekly trend to confirm its higher upward potential. Watch if there’s upward follow through price action. For now, I’ll stick to my range in the short run.
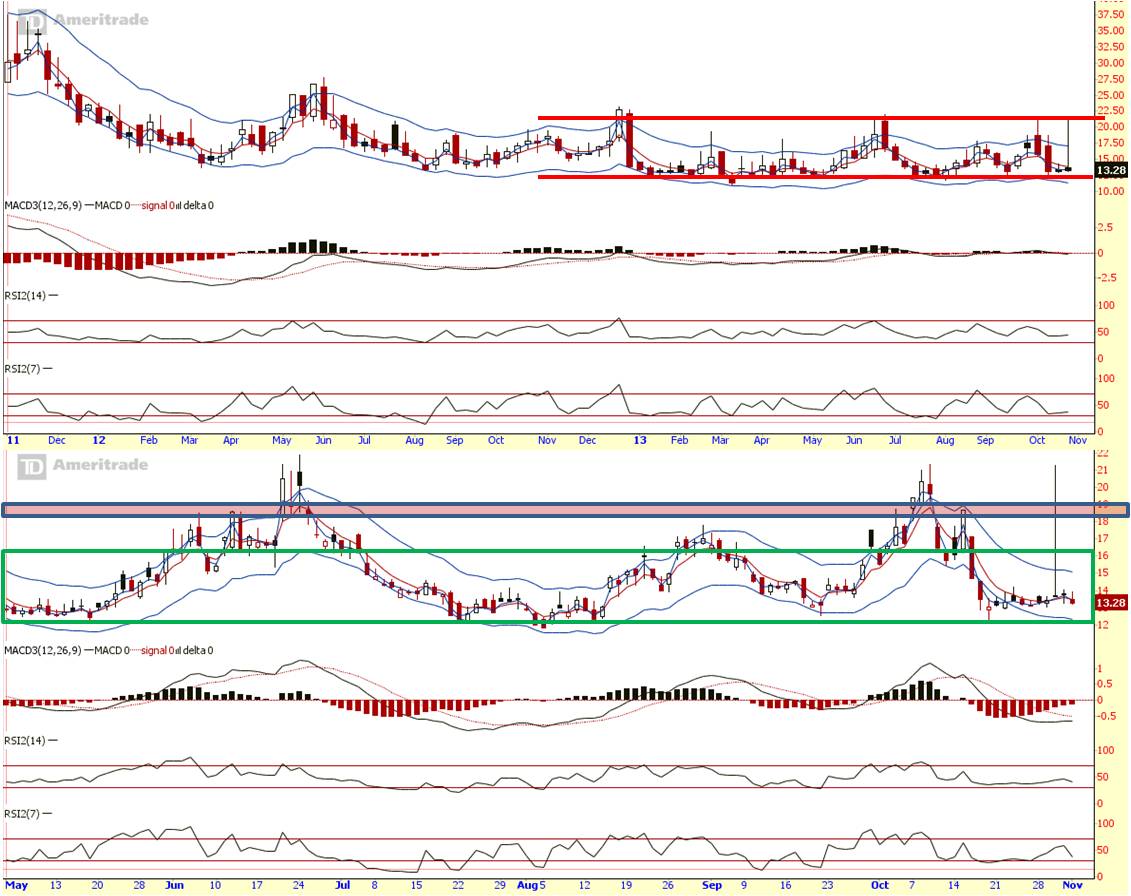
VIX (Fear index) weekly and daily is at the bottom of its support zone. On the daily, it is not going anywhere. And as discussed last week, it might repeat what it did in July – Aug.
Summary:
Long term (monthly chart):
UP (overbought)
Mid term (weekly chart):
UP (overbought)
Short term (daily chart):
UP (on its way to becoming overbought)
Long term and mid term trader, stay long or stand aside. Short term trading may focus on the range for short and long opportunities.
My prediction is VIX will range abit and spike. It might take days, or weeks or months (i doubt it will take so long). Meanwhile, big picture will also range or trend slightly higher with volatility. If VIX broke support, I will change my opinion.
Cheers
Strongerhead ways to becoming a better trader
NOTE: All information provided “as is” for informational purposes only, not intended for trading purposes or advice.
