As the daily chart and VIX from last week’s analysis suggested, the dip has crystallized. But the rally last Friday, was it a dead cat bounce or that marks the end of the dip? Let’s take a look at the charts.
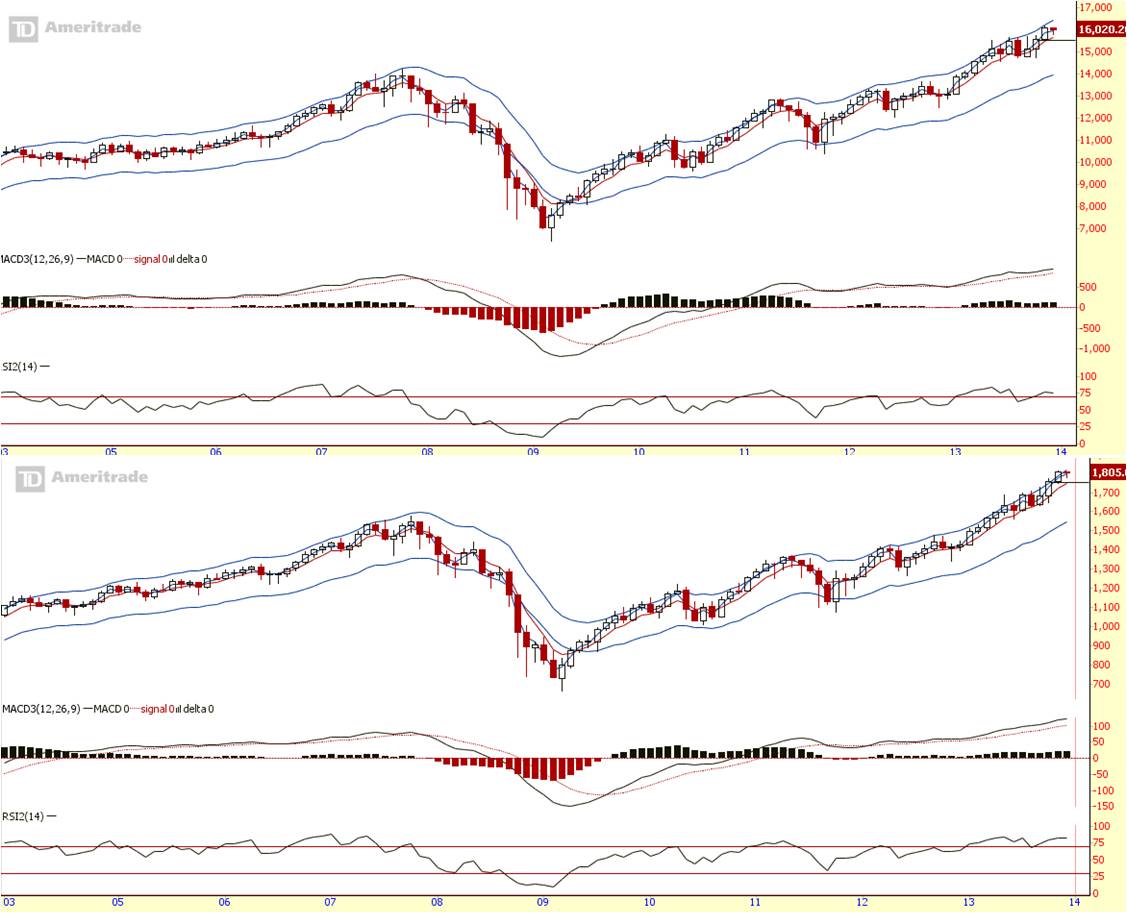
Long term trend is UP. The monthly candle is red, but still in its infant stage since there’s many more days before this candle or bar gets fully formed. Both Dow and S&P prices are above their support so far. Dow seems to have more room to run as compared to S&P since its price has not touch the price envelop unlike what S&P is currently doing now.
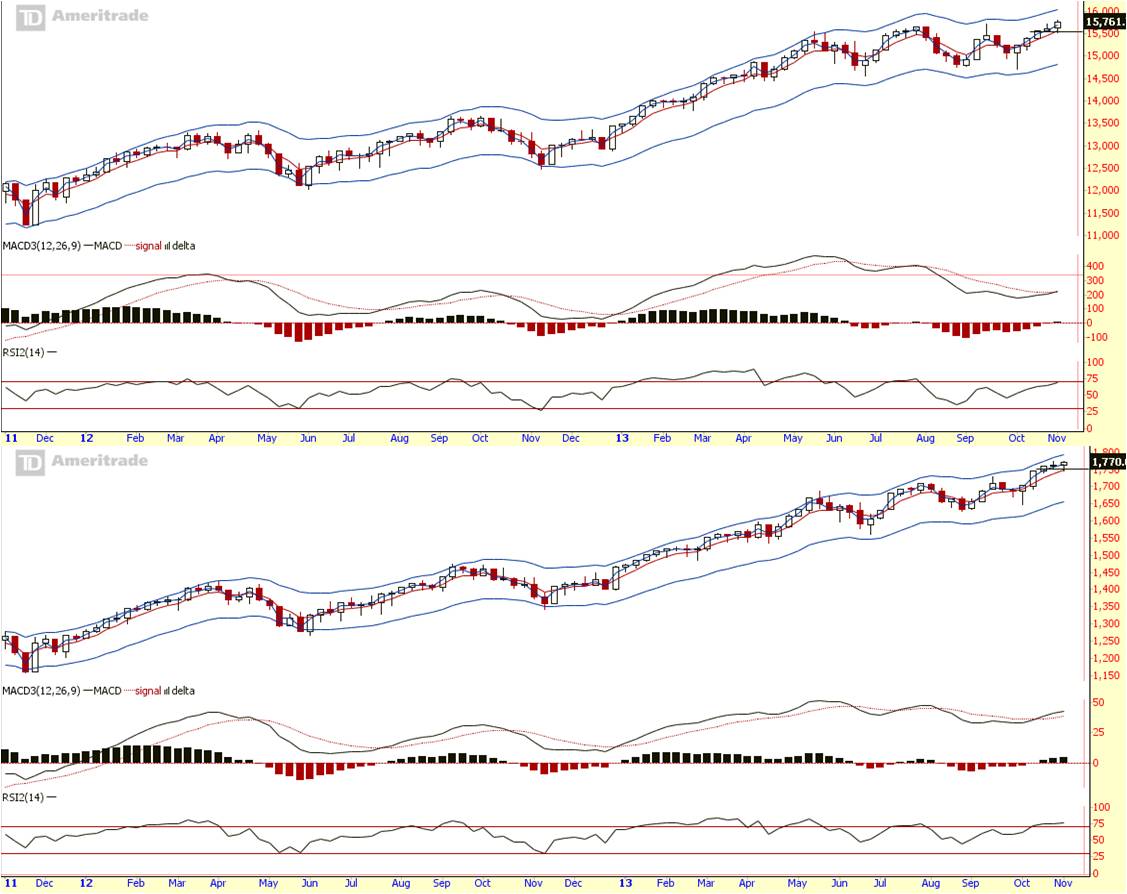
Mid term trend is UP. Vitals are still looking strong, although it is still in overbought condition even though the weekly candle or bar is in red. This could be buying opportunity for the bulls.
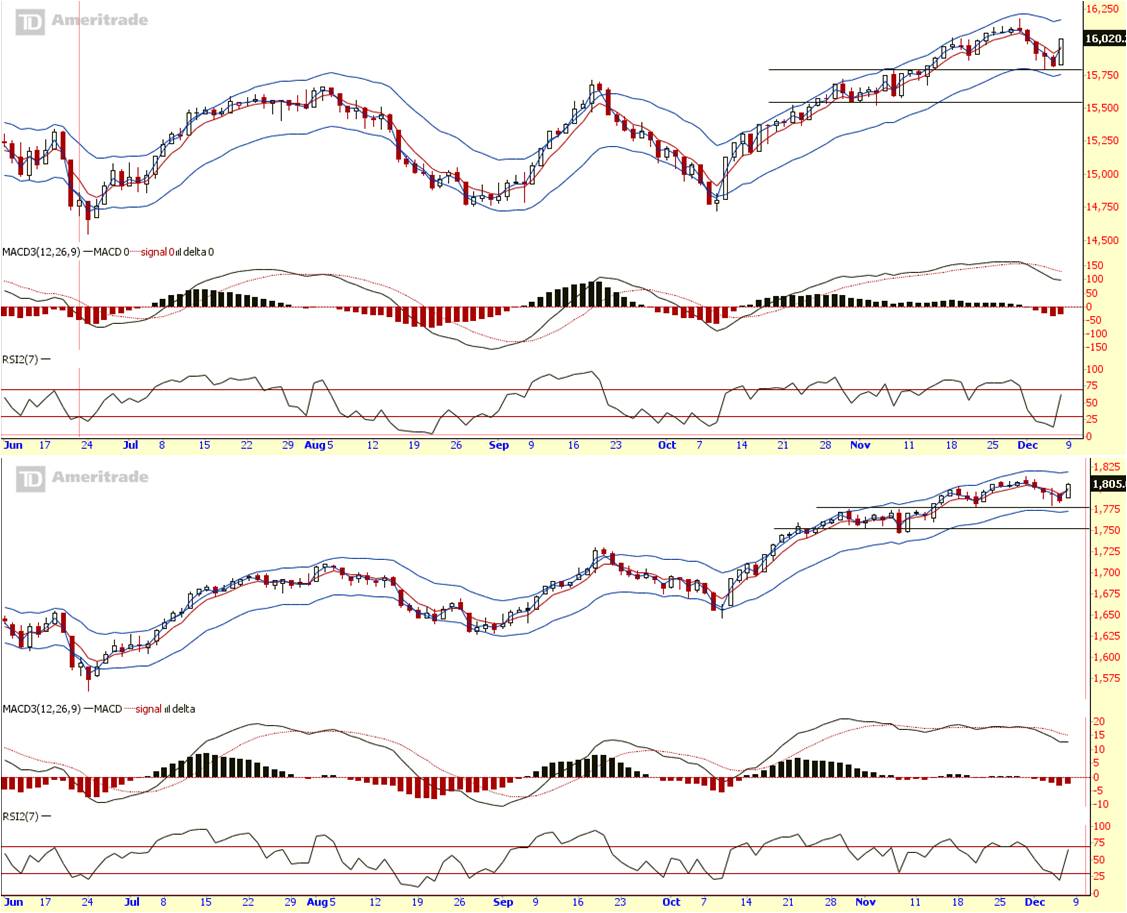
The short term trend is UP. Initially, the trend was down, but on the fifth trading day, the strong rally has reversed the short term trend back on its way UP.
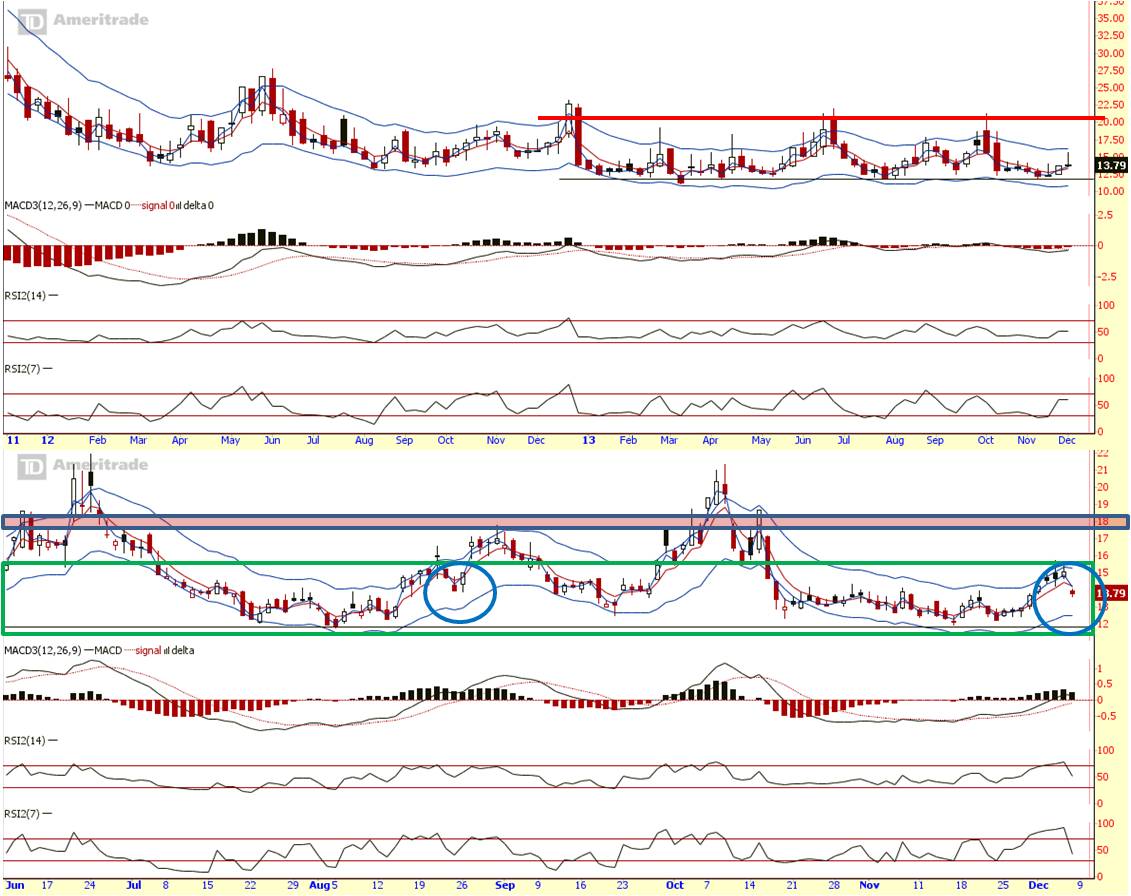
VIX (Fear index) mid-term price made a strong upward move, but the top of its price envelop rejected the move and price came crashing down forming an ugly bearish tail which favours the bulls.
On VIX daily chart outlook, price pattern is getting even closer to Jul-Aug 2013 formation. It reached the top of its enveloped and dropped to the same level as 23 Aug (refer to the two blue small circles). Just be cautious of a bear trap.
Summary:
Long term (monthly chart):
UP (overbought)
Mid term (weekly chart):
UP (overbought but did a dip in an uptrend)
Short term (daily chart):
Neutral (was down but on Friday, seemed to be back on its feet)
To take the bull ride, we have to wait for a dip. Since the weekly chart had dipped, it is a chance to take the ride as soon as the daily chart stop going down. And on Thurs, when prices hits oversold level marks an important low. It didn’t take a long time to prove this signal. This is the window to take the ride. But it is hard to jump onboard after a close to 200 points Dow upwards movement. If you are going to take the ride up, a stop around 50% from last week’s closing is advisable. Or better still, hedge your positions for a defensive play, which would be my preference.
Based on a possible repeat of Aug VIX price movement, just have got to be wary of the bear trap should VIX rallies to $17. But if it does reaches that level, it gives more upside for the bulls to charge later.
Cheers
Strongerhead ways to becoming a better trader
NOTE: All information provided “as is” for informational purposes only, not intended for trading purposes or advice.
