Prices move higher. Is that the end of correction?

On the weekly charts, RSI is moving upwards. EMA is about to cross. If EMA fail to cross, it means all action from last two weeks are just a bounce from a down trend. If it crosses, end of correction.
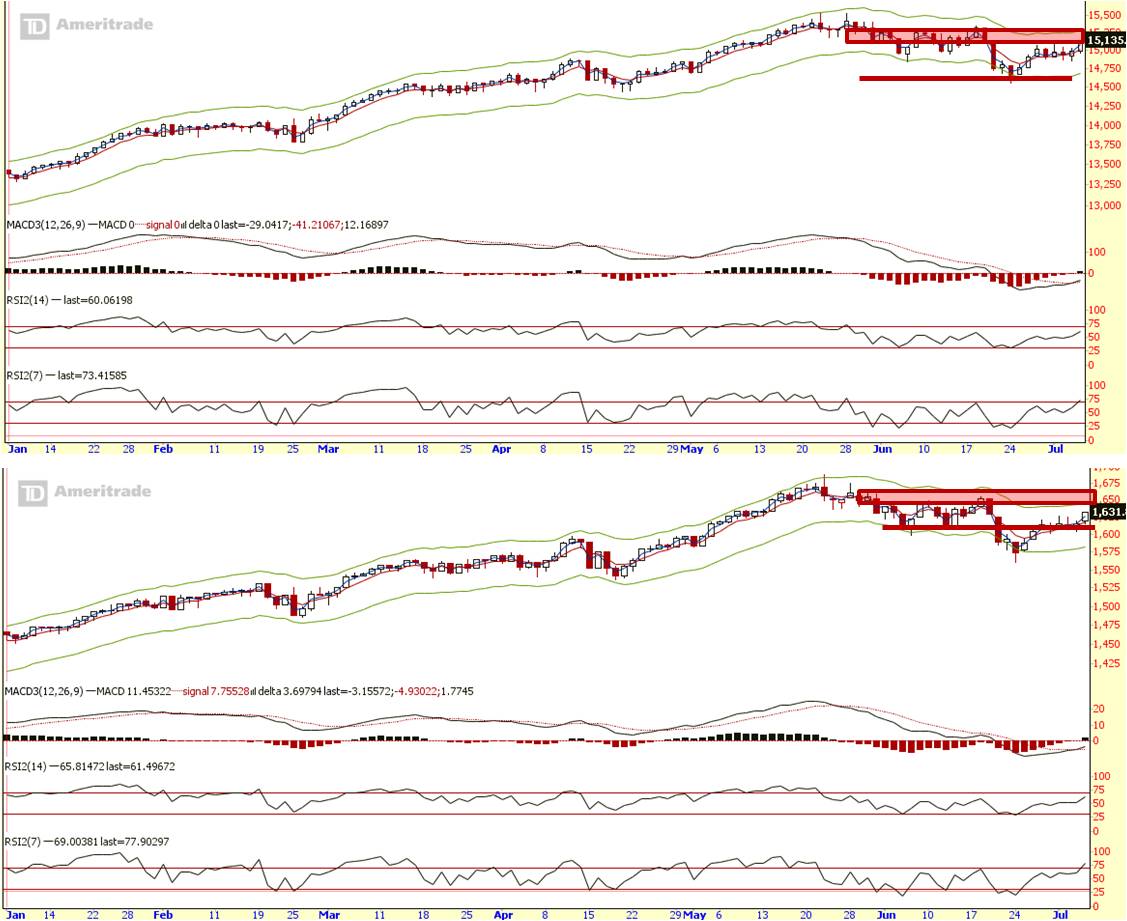
On the daily charts, prices still has not broken above the red zone. If it does and stays above, the above scenario would happen.
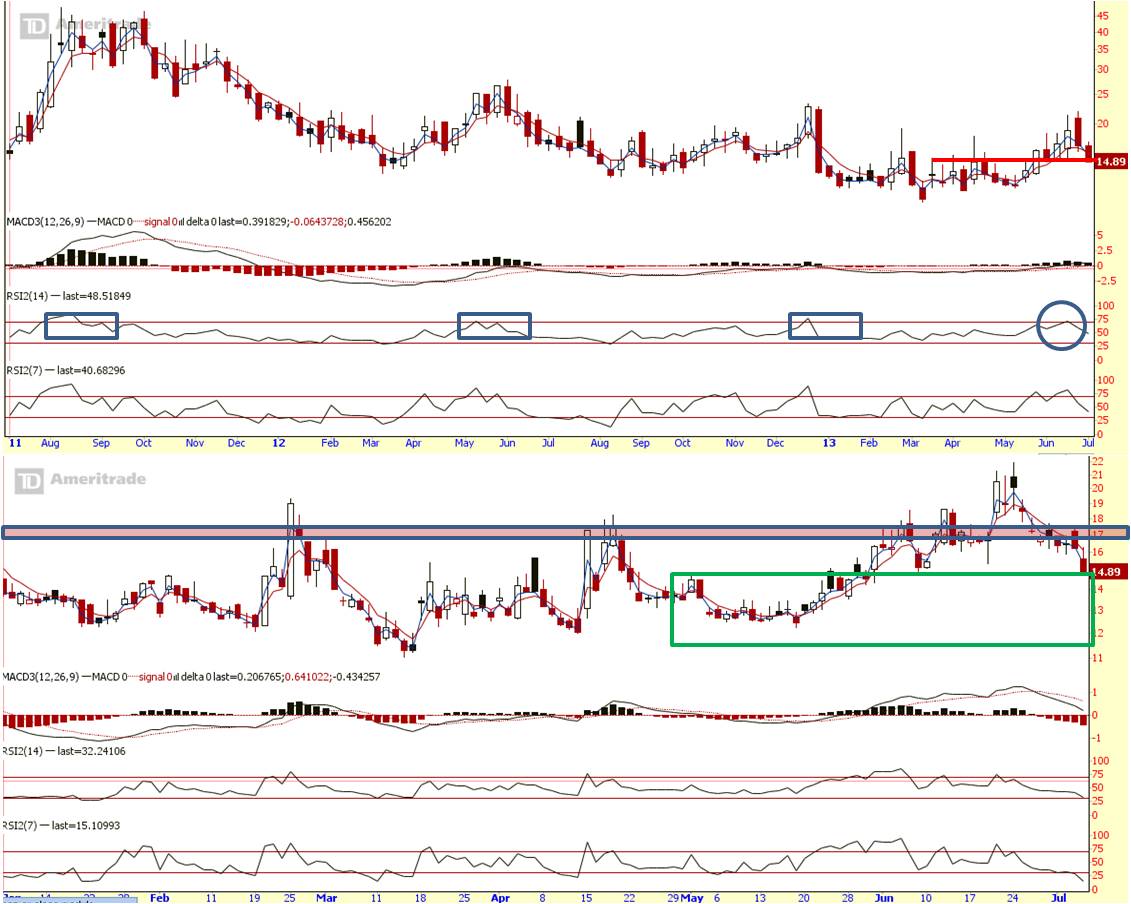
VIX (fear index) weekly price is sitting on the red line (as shown on the weekly chart). Daily chart price showed that it is sitting on the edge of the green box. If price continues to go lower and sit within the green box, bears are contained.
Summary:
Midterm view:
We are in mid-term down trend, on the verge of a rally that ends the correction.
Short term view:
If resistance is broken, and VIX support failed to hold, end of correction confirmed.
But VIX daily is in oversold zone. VIX weekly is near oversold zone. This increases a possibility of bears fighting back. It might happen next week or the week after next.
If bears action takes place first before Dow and S&P break above resistance, the correction might resume.
If bears action takes place after prices have break above resistance level, it would probably be only a test of resistance, unless prices reverse below the resistance zone.
Watch these signals to position your trades carefully.
Cheers
Strongerhead ways to becoming a better trader
NOTE: All information provided “as is” for informational purposes only, not intended for trading purposes or advice.
