Last week 24 Mar analysis, we said bears were looking dangerous. But not dangerous enough to push the market lower despite several battles fought between the bulls and bears creating a volatile trading week which ended only slightly in the red. What might be the outlook for April?
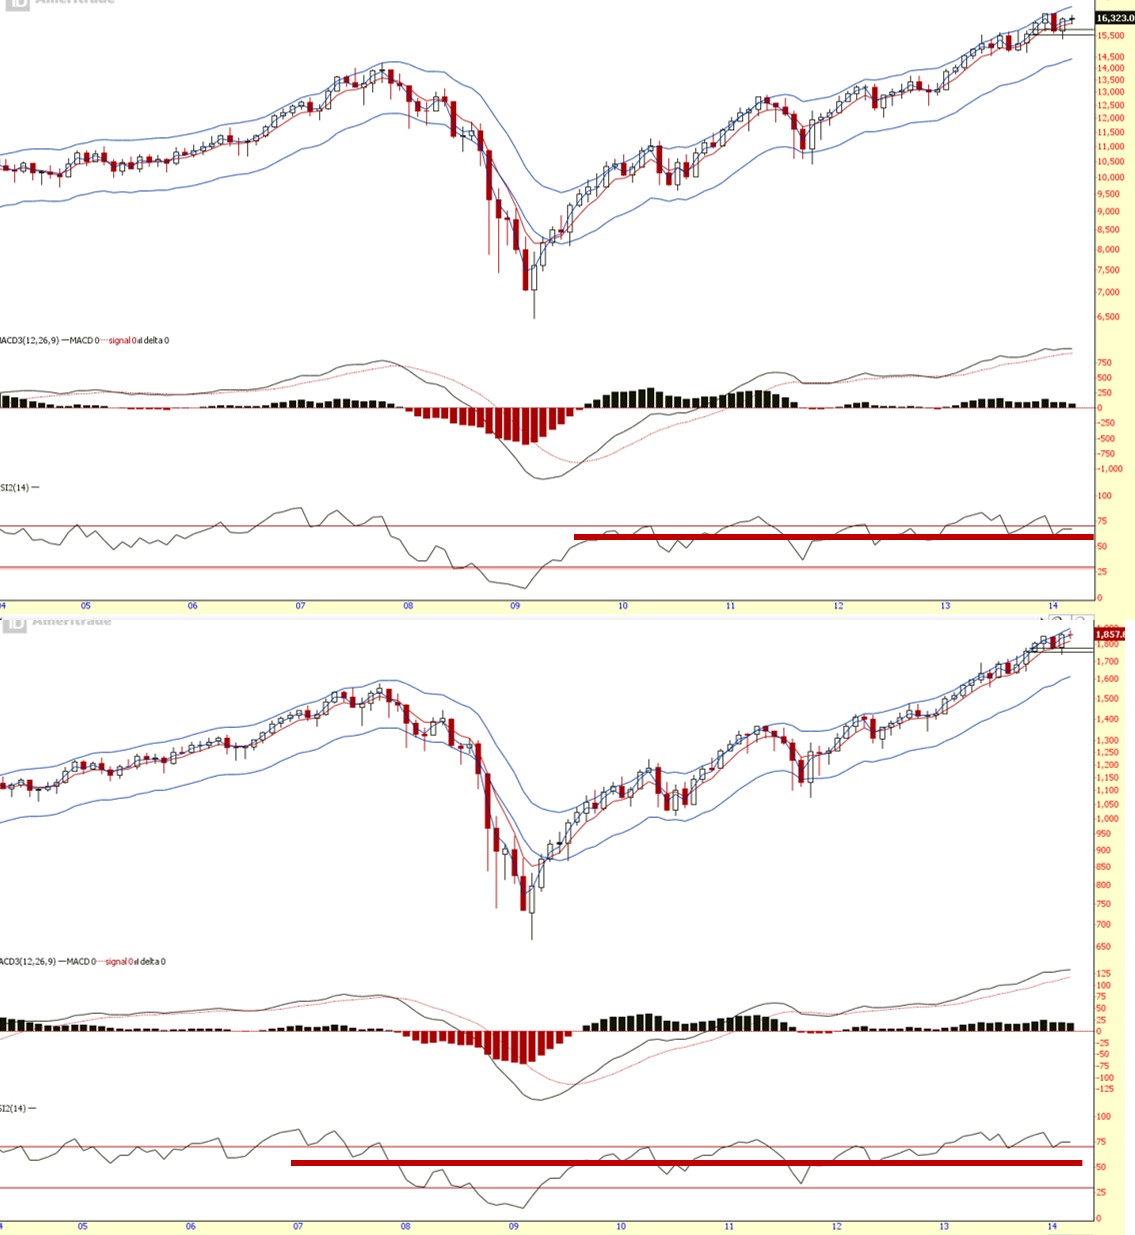
Monthly chart (which helps project the longer term perspective of the market trend – chart as shown above), for the Dow, it has turned from red to green. S&P still slightly in the red but we cannot denied the bulls efforts from pushing prices away from its low. 31 Mar marks the last day of the month. Anything can happen to close the month in red or green before we move into supposedly one of the most bullish month of the year, April. Let’s take a look at the odds on what might be the outlook for Apr ahead based on the charts below.
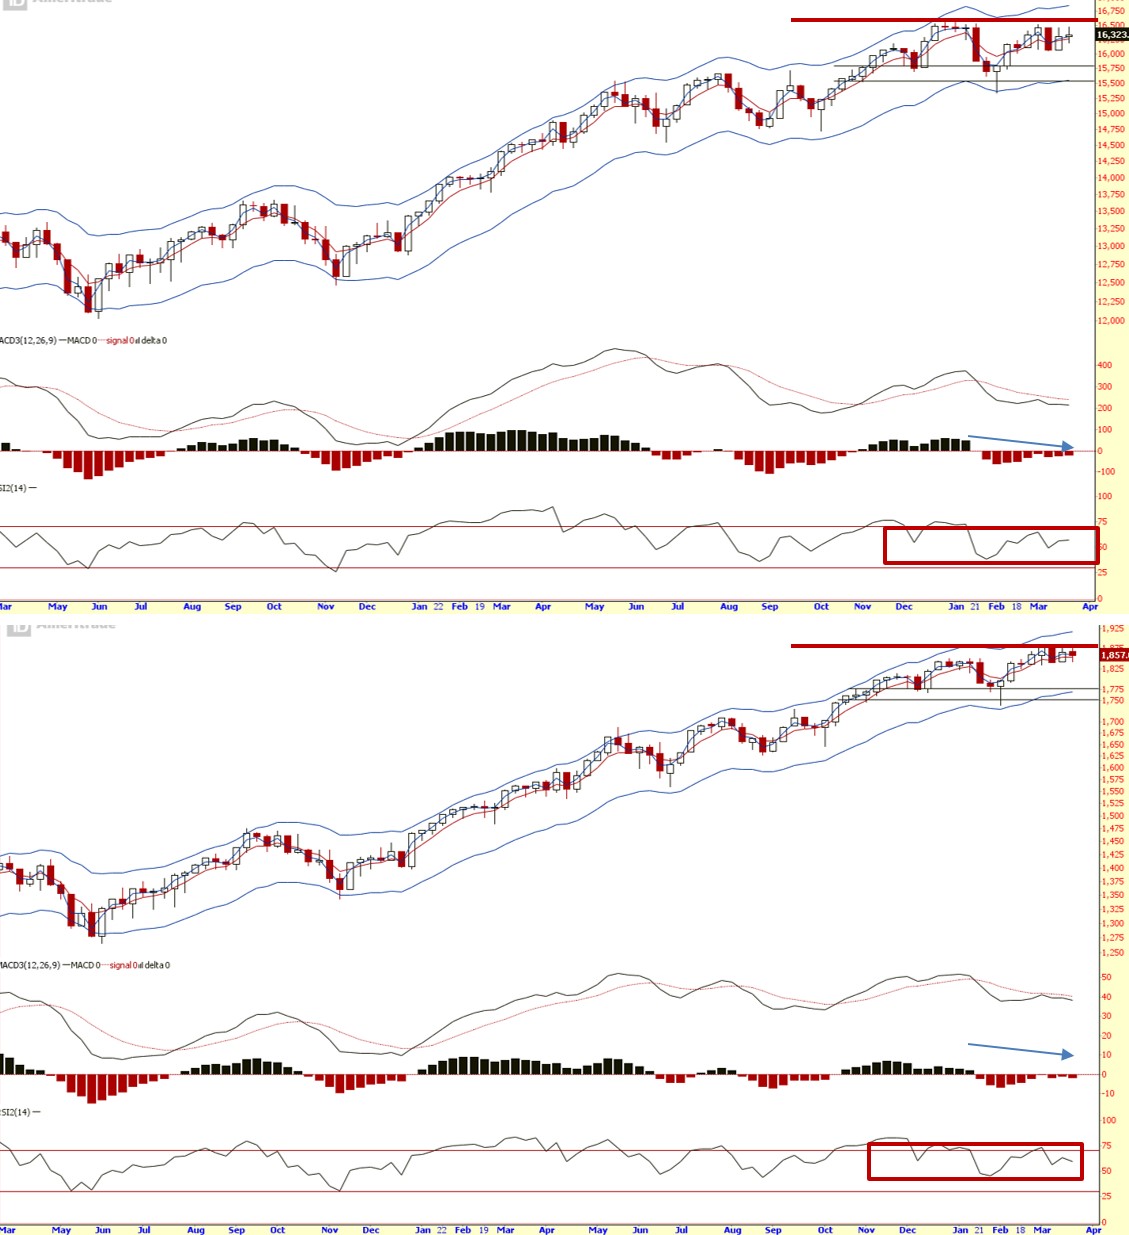
Weekly chart (which helps to project the mid term perspective of the market trend – as shown above) not favouring the bulls still. Resistance level holding, MACDH ticked down lower on S&P (except Dow). Will it go lower in the coming week, let’s see what Daily chart looks like for insights.
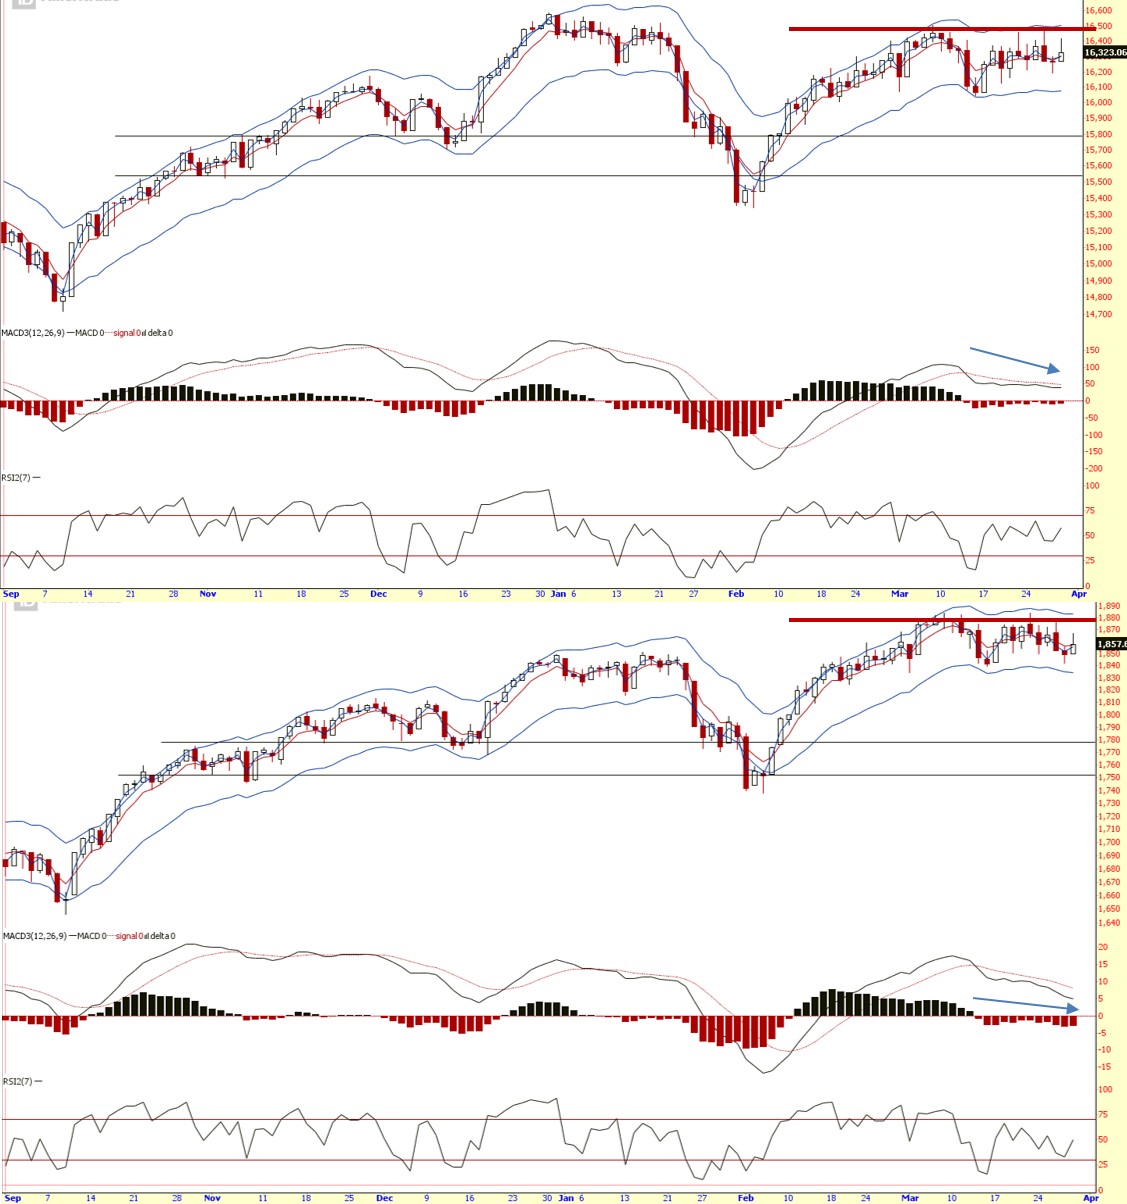
Daily chart (which helps to project the short term perspective of the market trend – as shown above) still directionless. On Thurs, market rejected its low, but on Fri, market rejected its high.
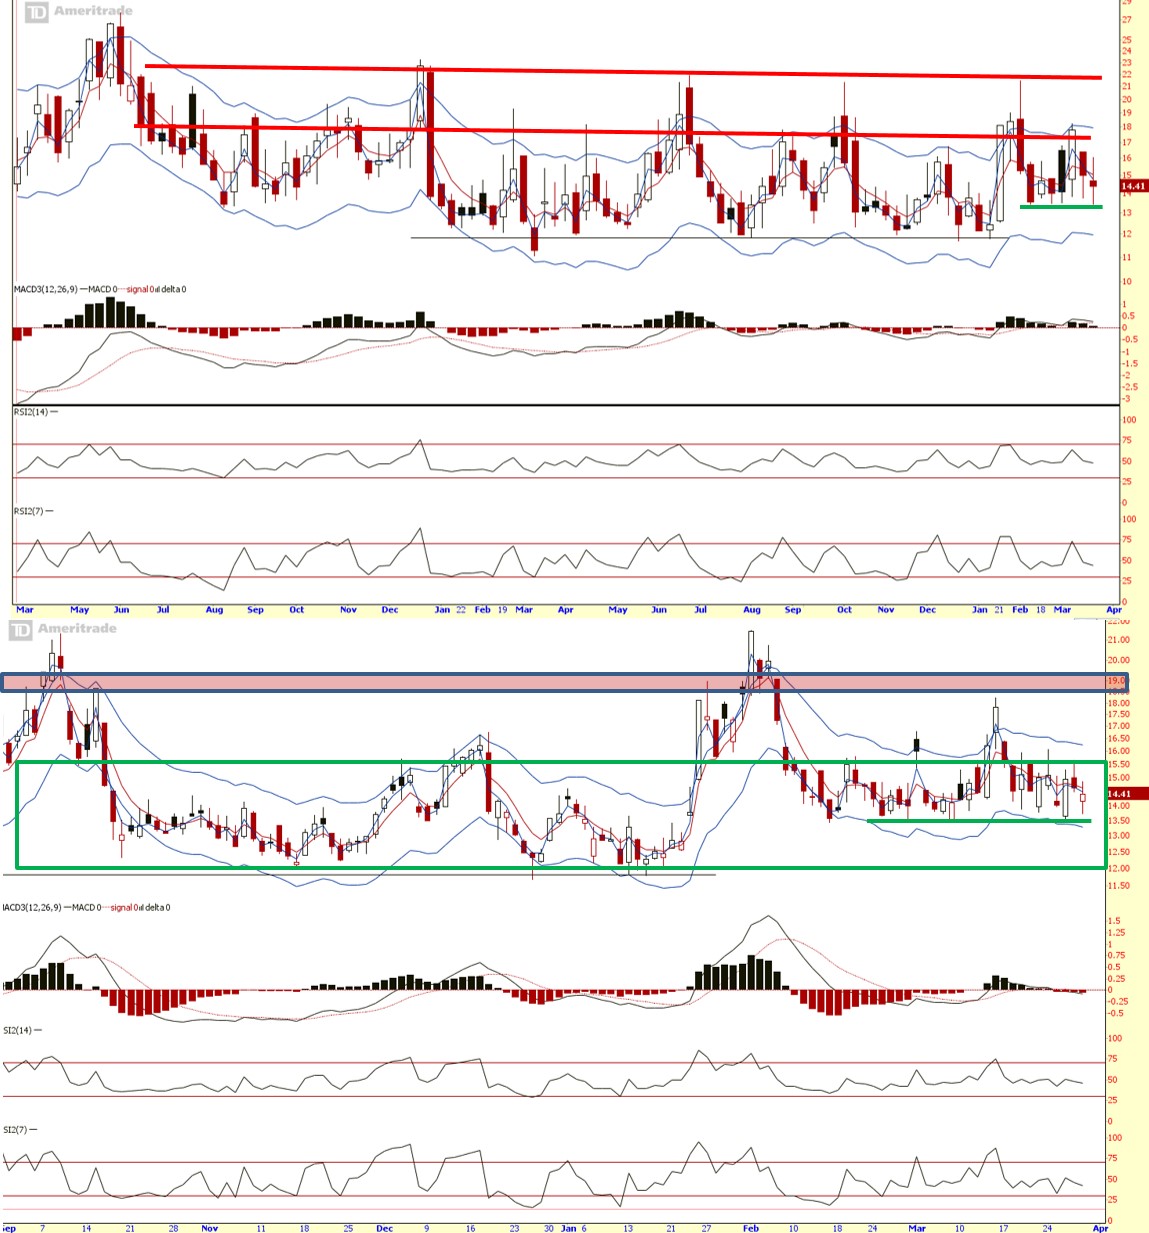
VIX (Fear index) mid-term and short term price is still ranging and the green horizontal short term support line is holding. Doesn’t look like it is going anywhere for now. Usually, it will not stay in neutral zone for a long time. But how long does it take to break out from its neutral ground, only god knows. However, he doesn’t trade.
Summary:
Long term (monthly chart):
UP
Mid term (weekly chart):
UP but flat. Strong resistance have to be broken or market stays in bearish mode.
Short term (daily chart):
Down to neutral. Fighting to turn back up on Friday but not successful. For now, I’m looking at it as a rally from its down trend.
VIX is near its lower level and kept rejecting its low. The probably of a spike is more likely than plunged deeper into oversold level.
Again, more reasons to be bearish than bullish in the coming trading week.
Cheers
Strongerhead ways to becoming a better trader
NOTE: All information provided “as is” for informational purposes only, not intended for trading purposes or advice.
