Market making new highs again. Should you continue to stand on the side or join the bulls afraid to miss the Bull Run?
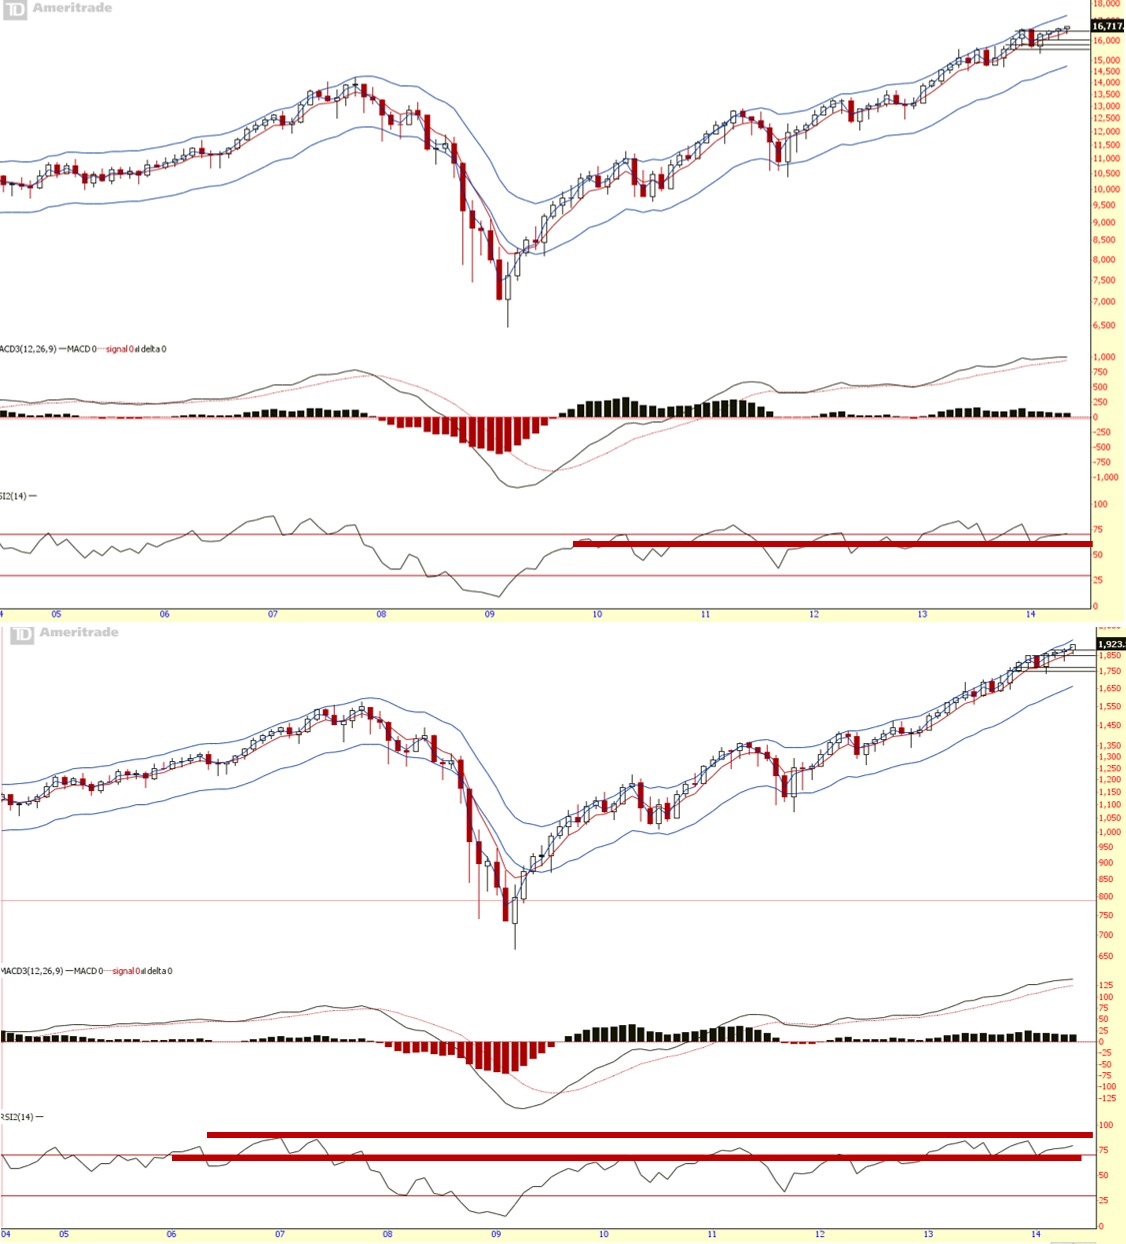
Monthly chart (which helps project the longer term perspective of the market trend – chart as shown above), both Dow and S&P UP. S&P showing sign of over cooked based on RSI.

Weekly chart (which helps to project the mid term perspective of the market trend – as shown above) showed prices breaking and staying above resistance. MACD div removed unless next week, it ticks lower.
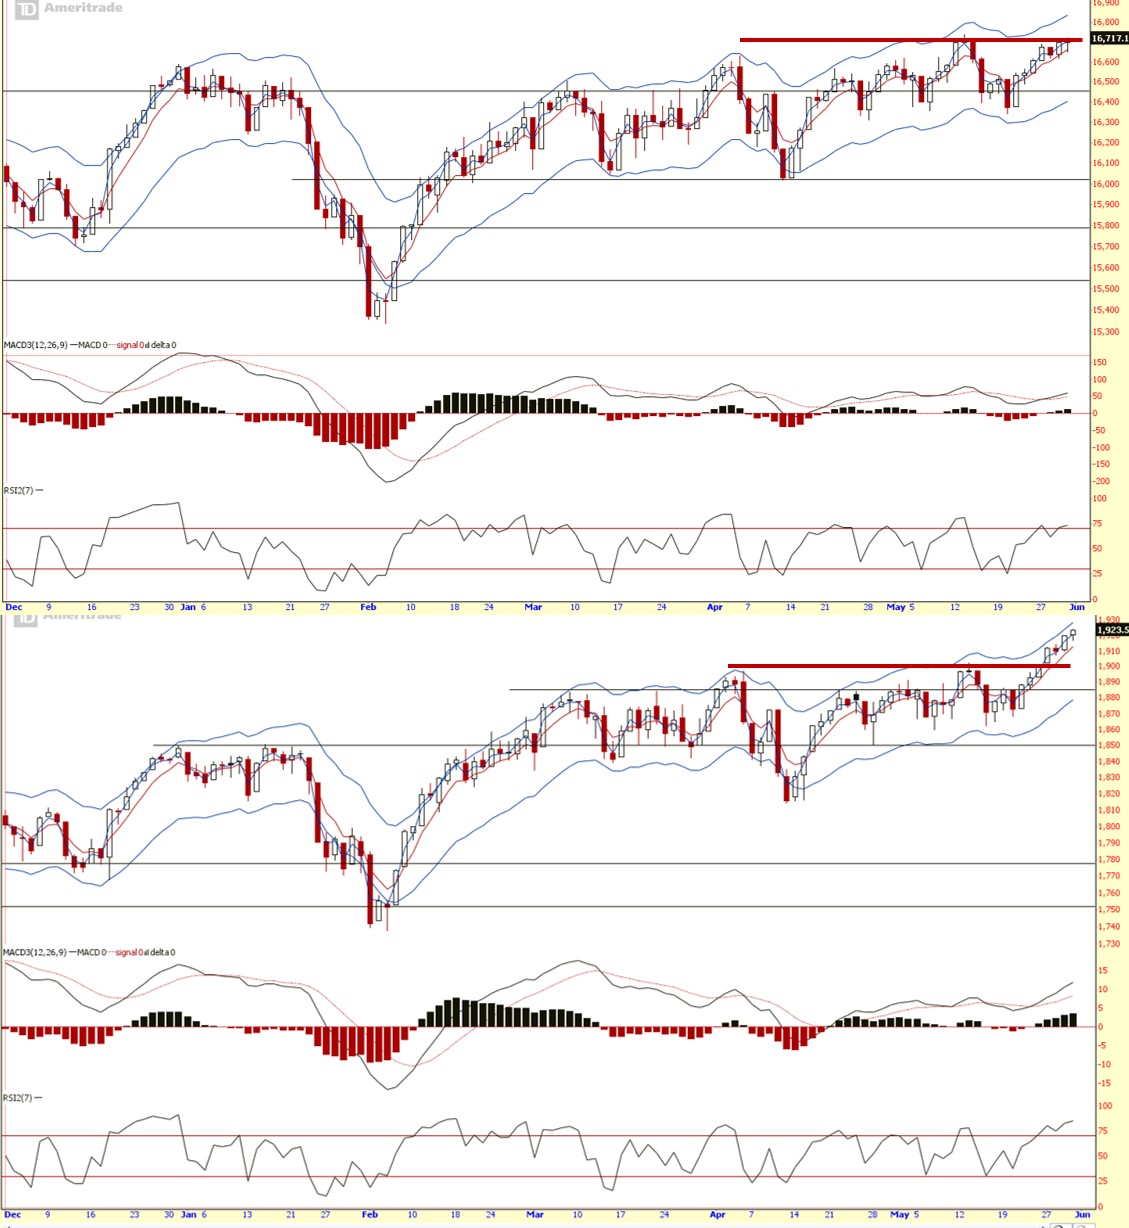
Daily chart (which helps to project the short term perspective of the market trend – as shown above) trend is UP. S&P is much more overcooked than Dow. Prices should cool off anytime soon. It doesn’t mean market will correct. It just mean prices tend to pause before any bigger movement resumes again.
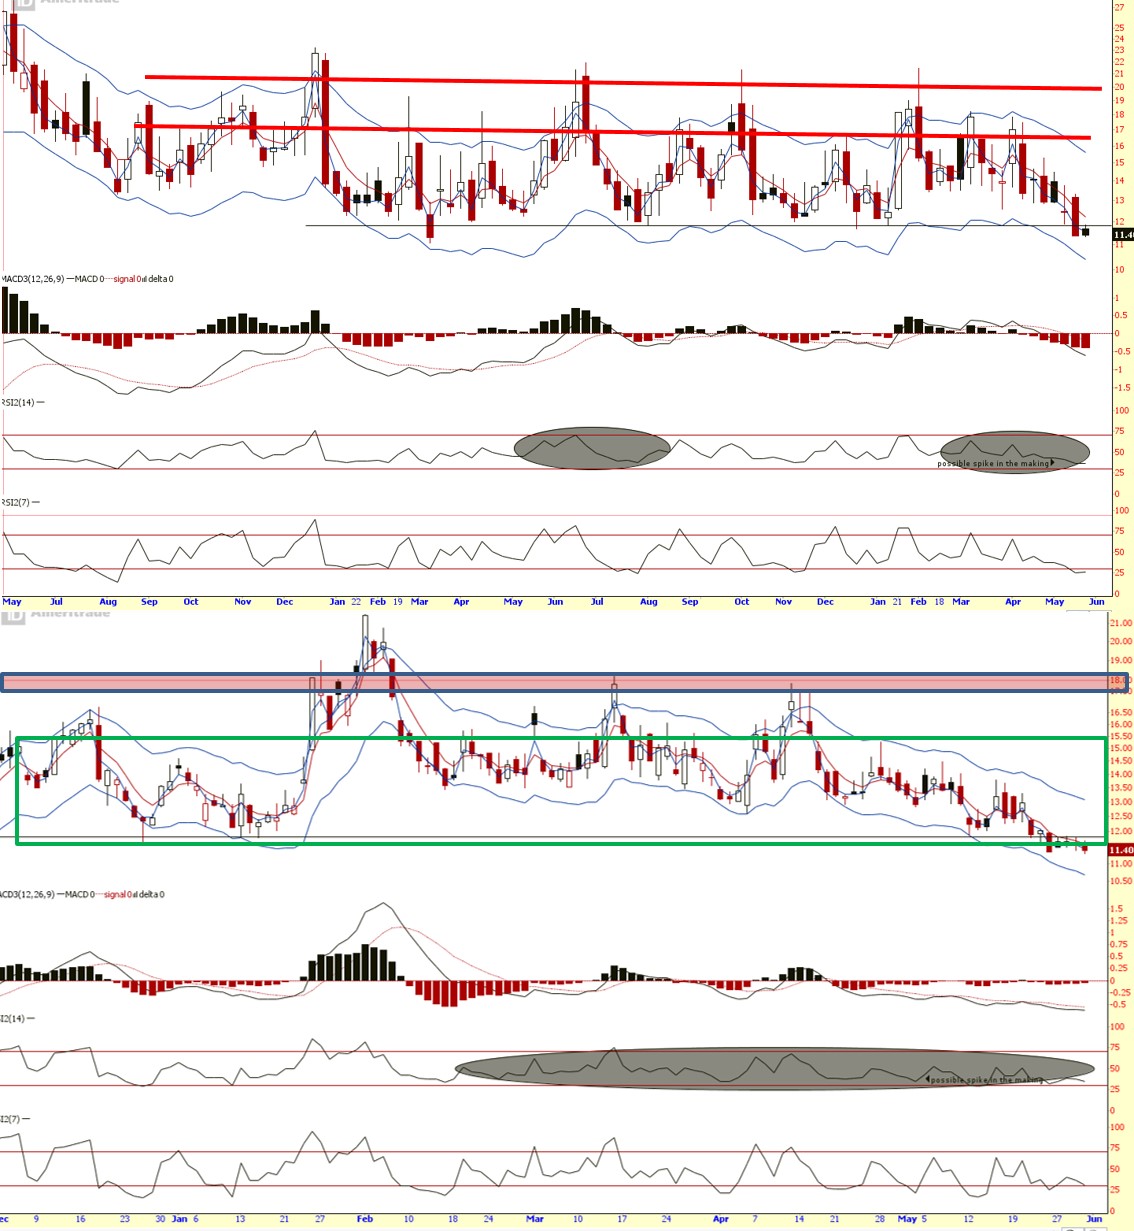
VIX (Fear index) mid-term and daily chart showing fear has been overwhelmed by greed. But on VIX daily, a base seems to be forming on the edge of the green box. Should it break lower, we can expect to see the market rallying to record high again.
Summary:
Long term (monthly chart):
UP
Mid term (weekly chart):
UP but not overbought enough.
Short term (daily chart):
UP
Mid Term Fear:
Low but some room to go deeper into oversold
Short Term Fear:
Low but a base seems to be forming. Watch the support line.
If trend is your friend, LONG or stand aside. Top is harder to catch. If i’m not wrong, VIX will fight back first, which means Dow and S&P will cool off slightly and another rally to a new high will happen in the coming week.
Cheers
Strongerhead ways to becoming a better trader
NOTE: All information provided “as is” for informational purposes only, not intended for trading purposes or advice.
