If you had not missed my last week’s market analysis, it stated that VIX has some room to run still. But as soon as it reached the top of the green box, possible rally from the bulls would be triggered. And it did exactly that on Thurs and Friday. Does this mark as a possible reversal or a dip in the uptrend?
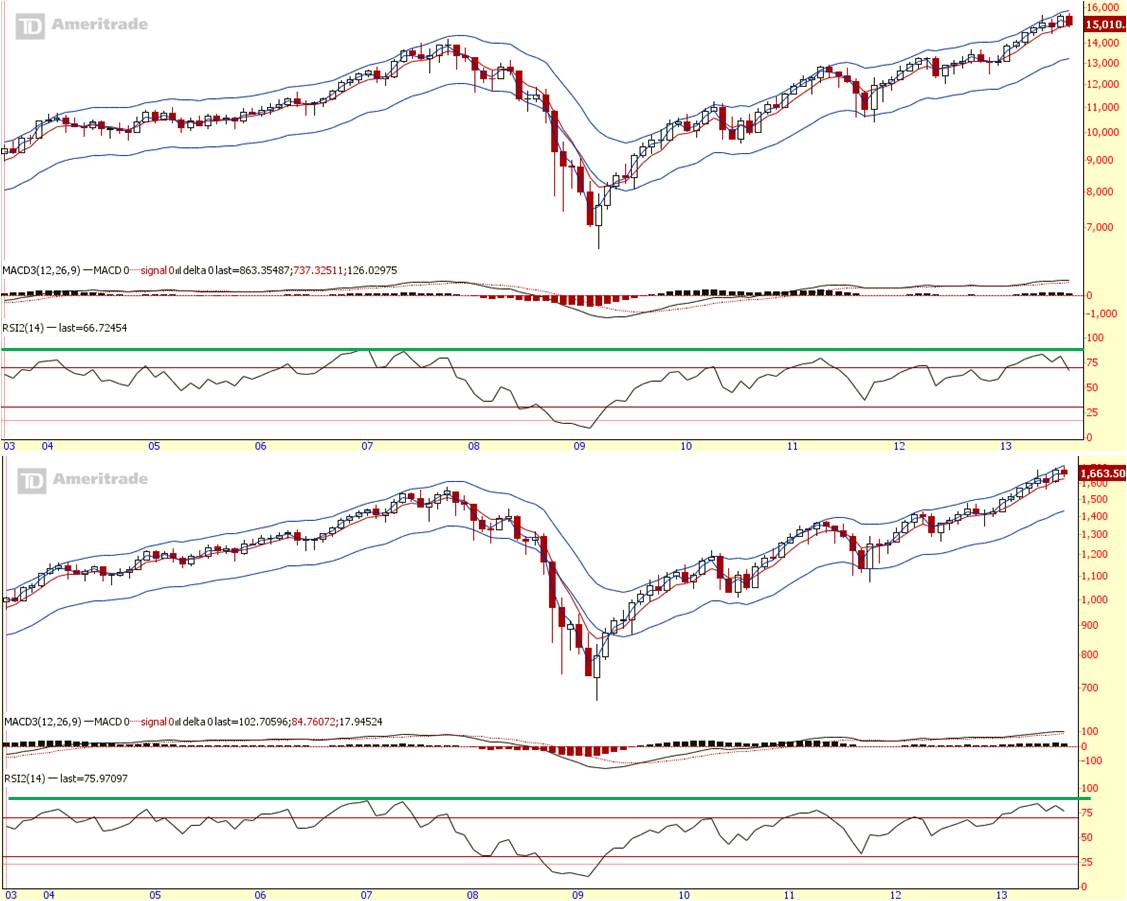
The long term trend is still up. But both leaders monthly candle for August 2013 are in the red, with Dow showing more weakness than the S&P. Monthly moving average seldom cross. If it does, it can last for a month to three months during a dip in an uptrend.
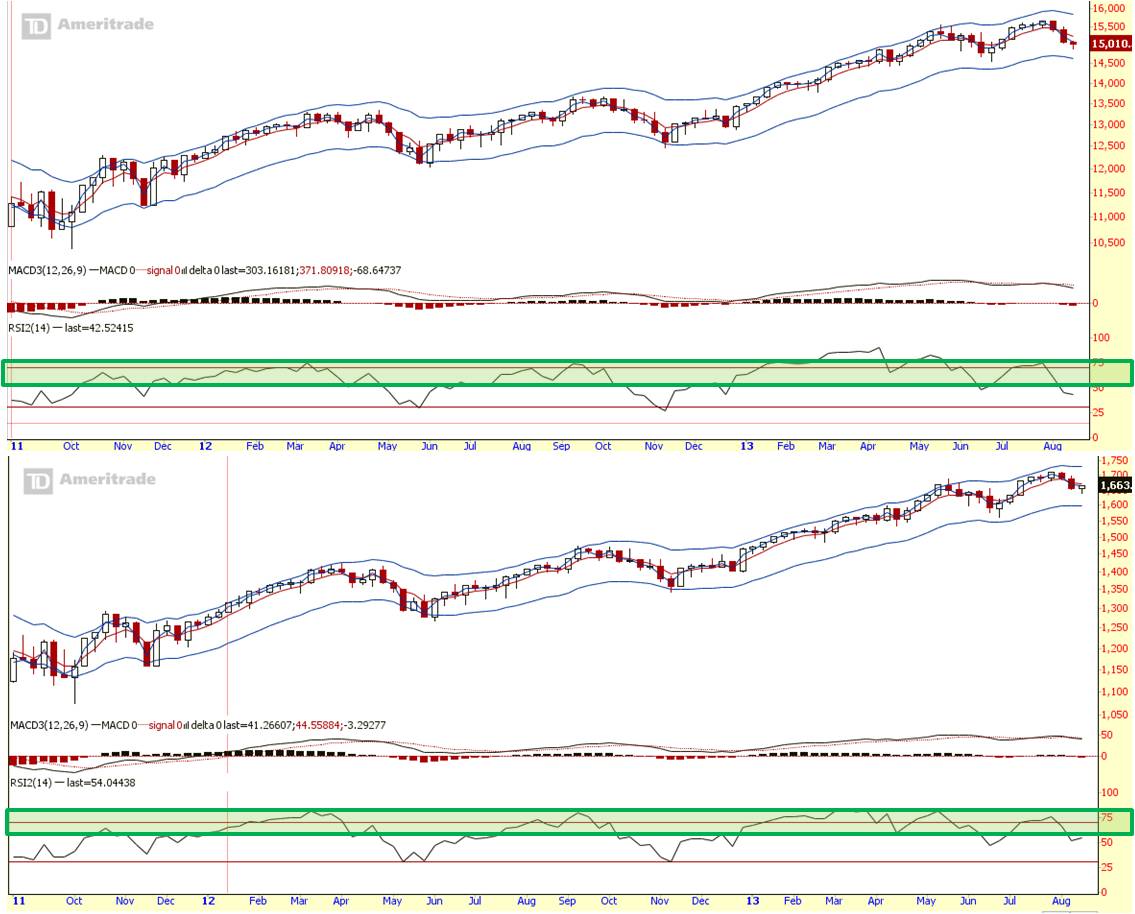
The intermediate term is in its mid-term down trend. S&P is still slightly more resilient than the Dow.
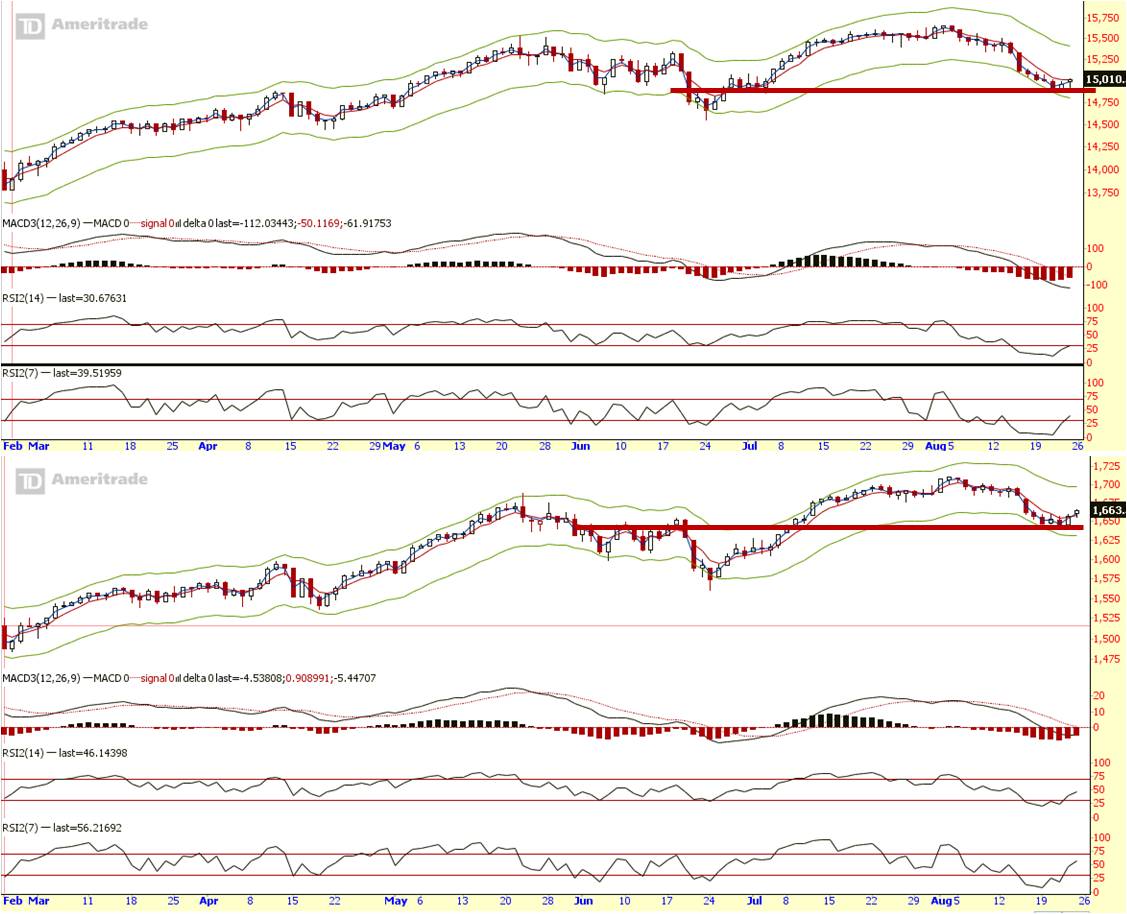
As mentioned last week, Dow and S&P doesn’t like to stay overbought, and a rally took place on Thurs and Fri last week. Dow is still struggling to reverse into a short term uptrend, but S&P has already confirmed a short term reversal is happening.
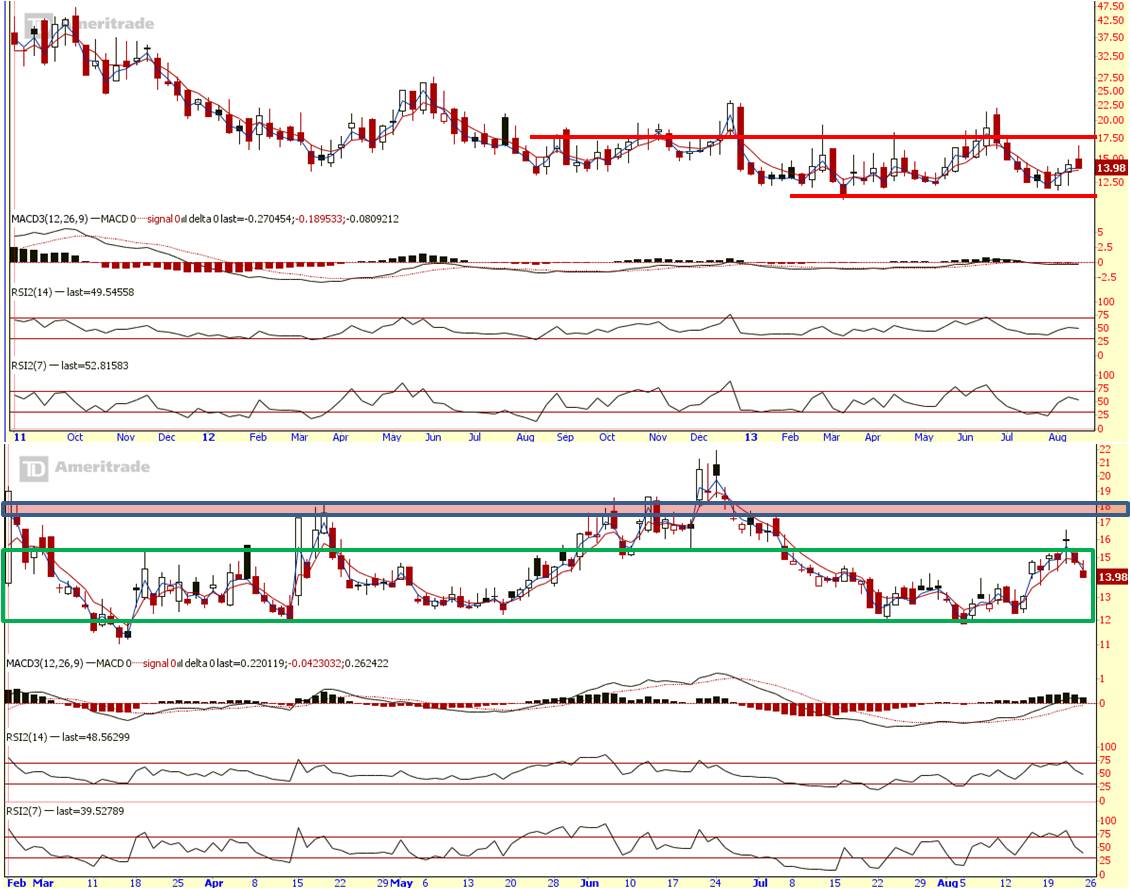
VIX (Fear index) weekly is still in a mid-term up move, but with VIX daily reversing into a short term down move as it reaches the top of its green box.
Summary:
Long term view:
Monthly trend is UP. (Possibility of a cross, but be weary of trap)
Mid term view:
Weekly trend is DOWN. (Possible reversal in the making if the daily price continues its rally)
Short term view:
Big brothers in short term up trend, with some room to move further upwards. If it can break through and stays above its resistance, it confirms the mid-term trend reversal. As such, I am on the bulls’ side until otherwise proven wrong.
Cheers
Strongerhead ways to becoming a better trader
NOTE: All information provided “as is” for informational purposes only, not intended for trading purposes or advice.
