I’m back in action. Last week, my laptop was not in working condition and has to be sent for repair. It was only when I was without my laptop that I realised how much I had depended on technology to trade, to socialise, and to make a living. Thus, never take anything for granted.
Without my market analysis, I felt less sharp last week. I learn my lesson not to trade using my phone without my proper charts in the future. Speaking of the future, let’s take a look at what the charts has got to say about next week’s market outlook.

We are nearing the end of July 2013. July has been very bullish. The trend is clearly UP. Although we are in overbought zone, but if you look at the 20 years chart, when RSI reach an extreme top, yes, it might pull back, but it also mean the bull run has some legs to go before a correction hits again.
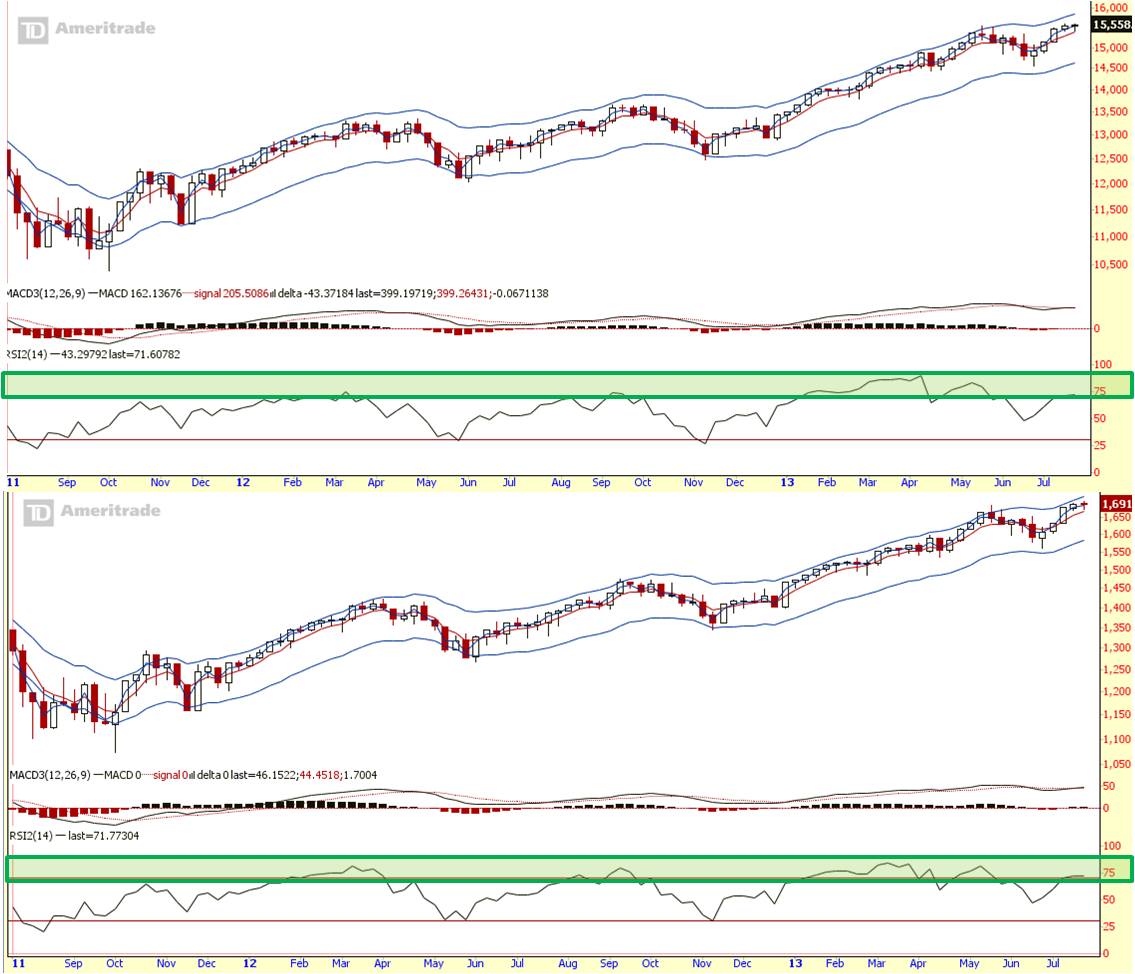
The intermediate term, the trend is UP also. There’s more room for the bulls to run before RSI hits an extreme overbought condition, and before price reach the top of its envelop again.
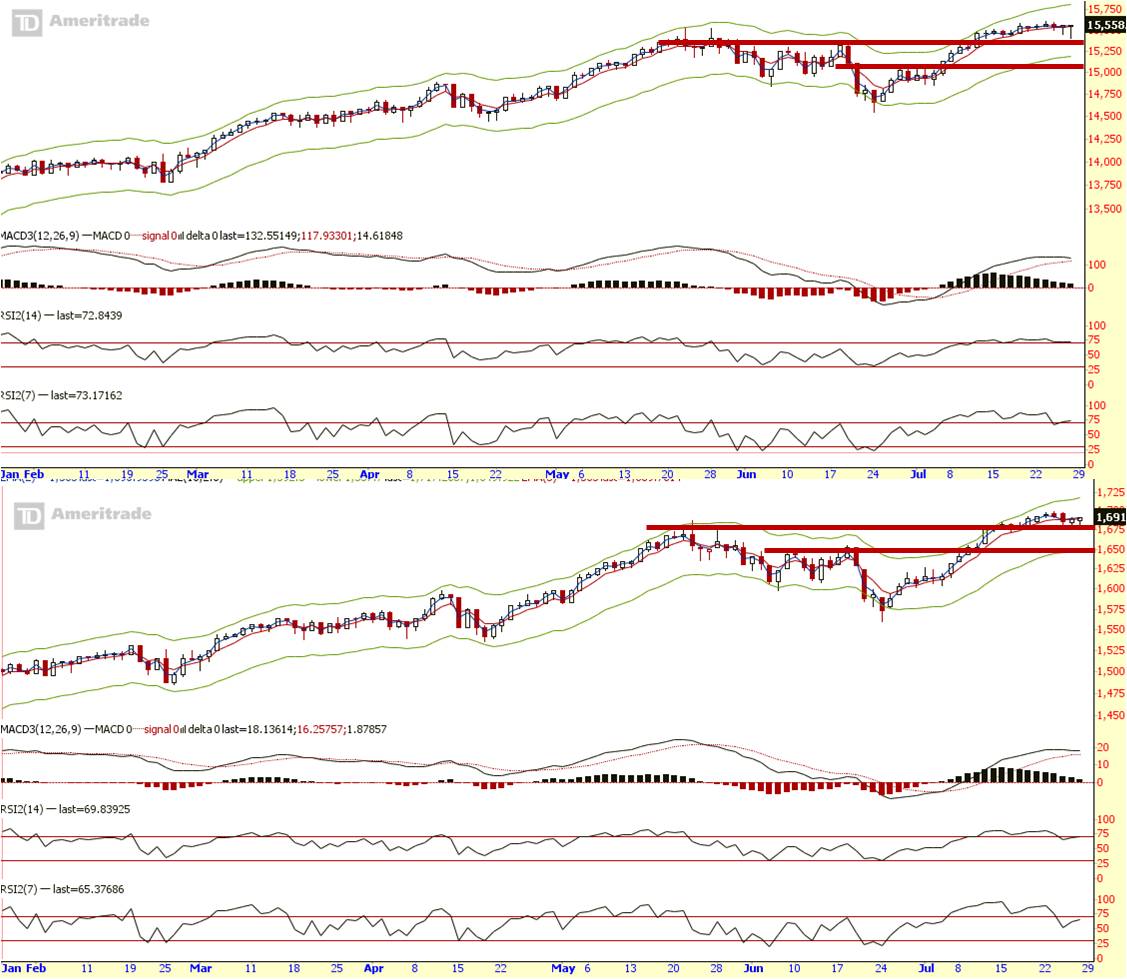
From the short term perspective, the trend is still UP, with the last two days of price action suggesting the market does not want to come down. However, the only danger sign is that price is sitting near its previous high. If this resistance turns support does not hold, a dip might be possible with the next support around 1650 on the S&P.
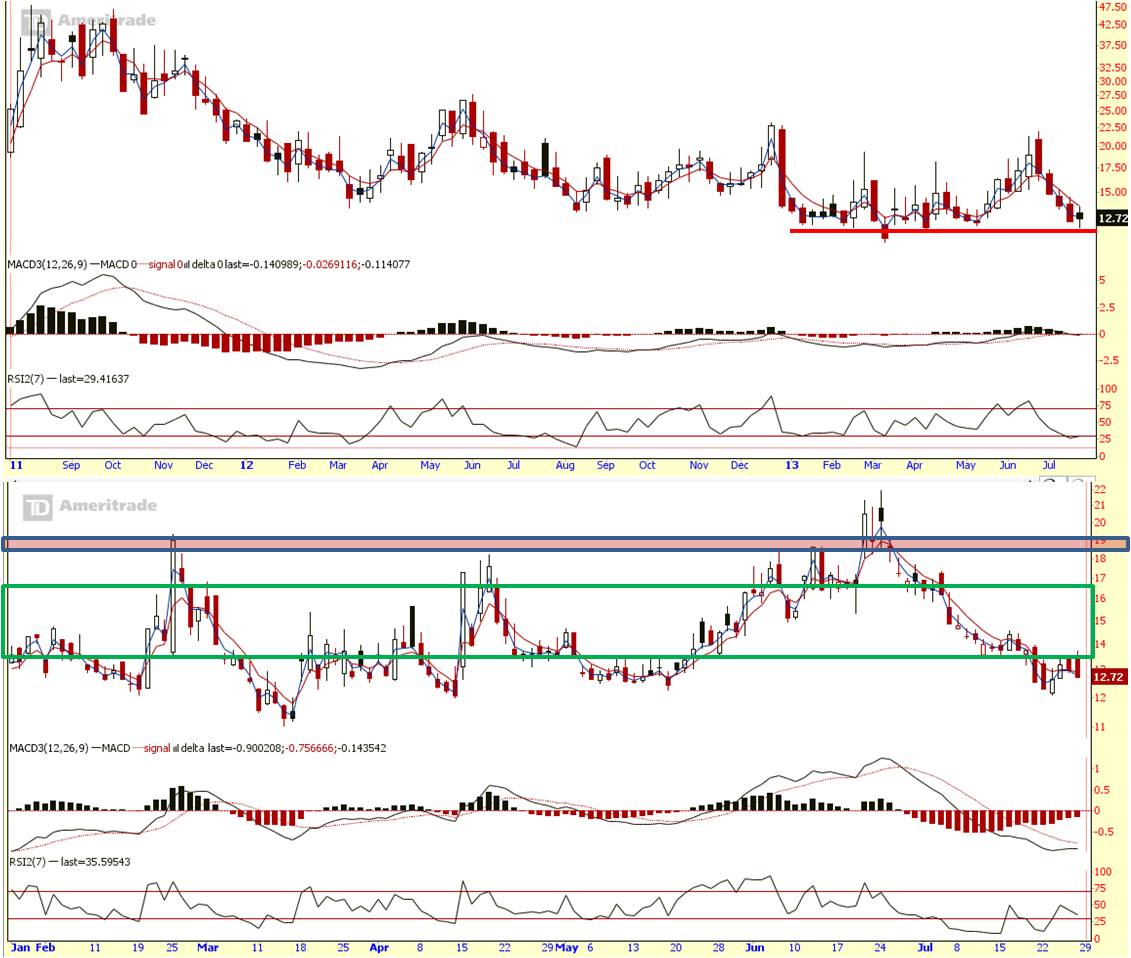
VIX (fear index) weekly outlook says the trend is down. Which is in line with the bullish story. However, on both weekly and daily charts, VIX is in oversold territory at present. On the daily, VIX is below the green box I have drew. VIX price can stay below the green box, but it does not usually stay below the green box, and remain oversold for long. An attack from the bears would not be too surprising in the short term.
Summary:
Long term view:
Monthly trend is UP.
Mid term view:
Weekly trend is UP.
Short term view:
The UP trend is looking tired, with a possible strike from the bears expected in the coming week or two. Especially if prices hit the top of its envelop in the coming week, that would increase the chances of a pull back. A dip in the uptrend would be good buying opportunity with a stop to protect yourself in case of a reversal.
Cheers
Strongerhead ways to becoming a better trader
NOTE: All information provided “as is” for informational purposes only, not intended for trading purposes or advice.
