Last trading week, as discussed and expected, it was bearish. My decision to close all my long was a correct one. Next week, is it time to long again? let’s take a look at the chart.
On the monthly chart (Not shown here), Sept closed with positive. Cot started off bullish for S&P but in the red for Dow. However, that’s just the start of the month. Things can change as there’s still a few weeks to go before the monthly price read of Oct complete itself.

On the weekly, Dow and S&P singing slightly different tunes. Dow looking more bearish than S&P. MACDH looking bearish. The only good sign is both candle stick showing a tail. Let’s see what caused the tail from the daily chart.
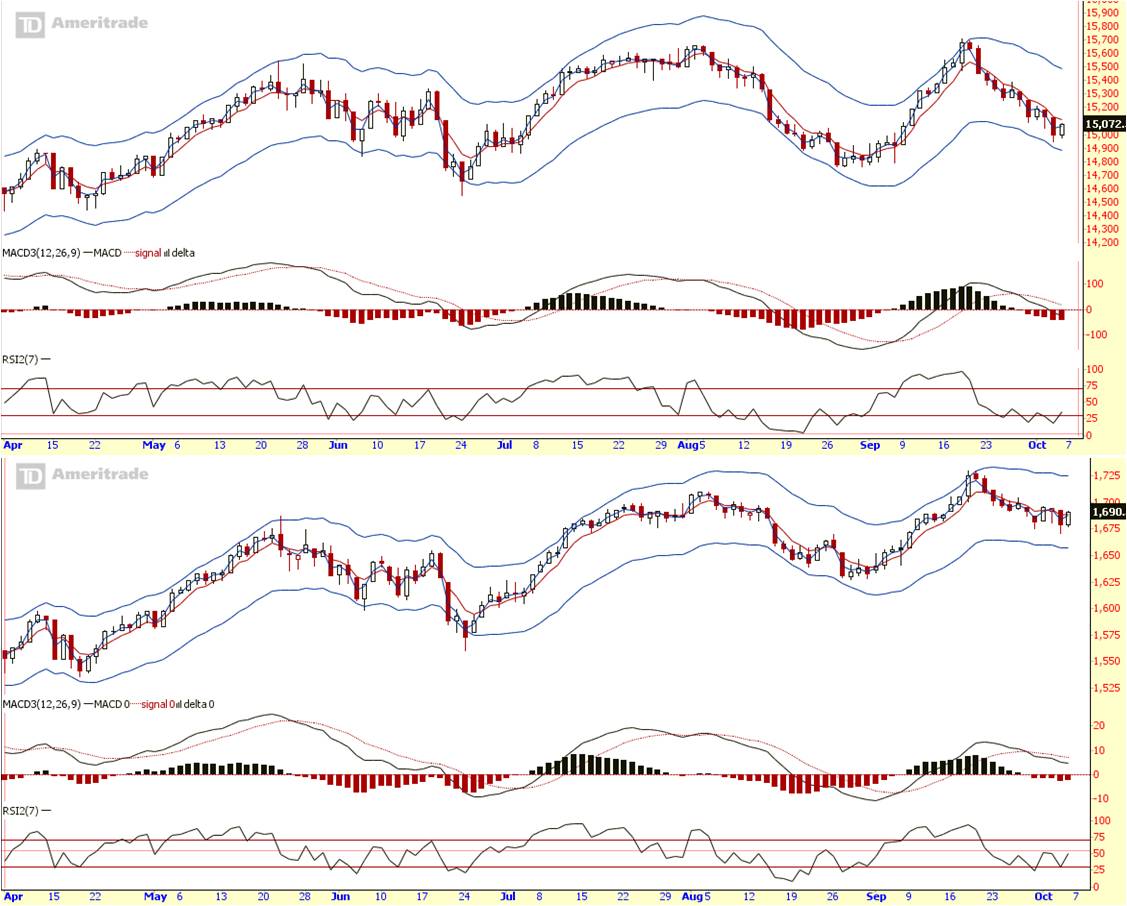
On the daily, Friday price action was bullish. MACDH ticks higher on both Dow and S&P. RSI moving further away from oversold. Especially on S&P, looks like a support has formed and it is holding.
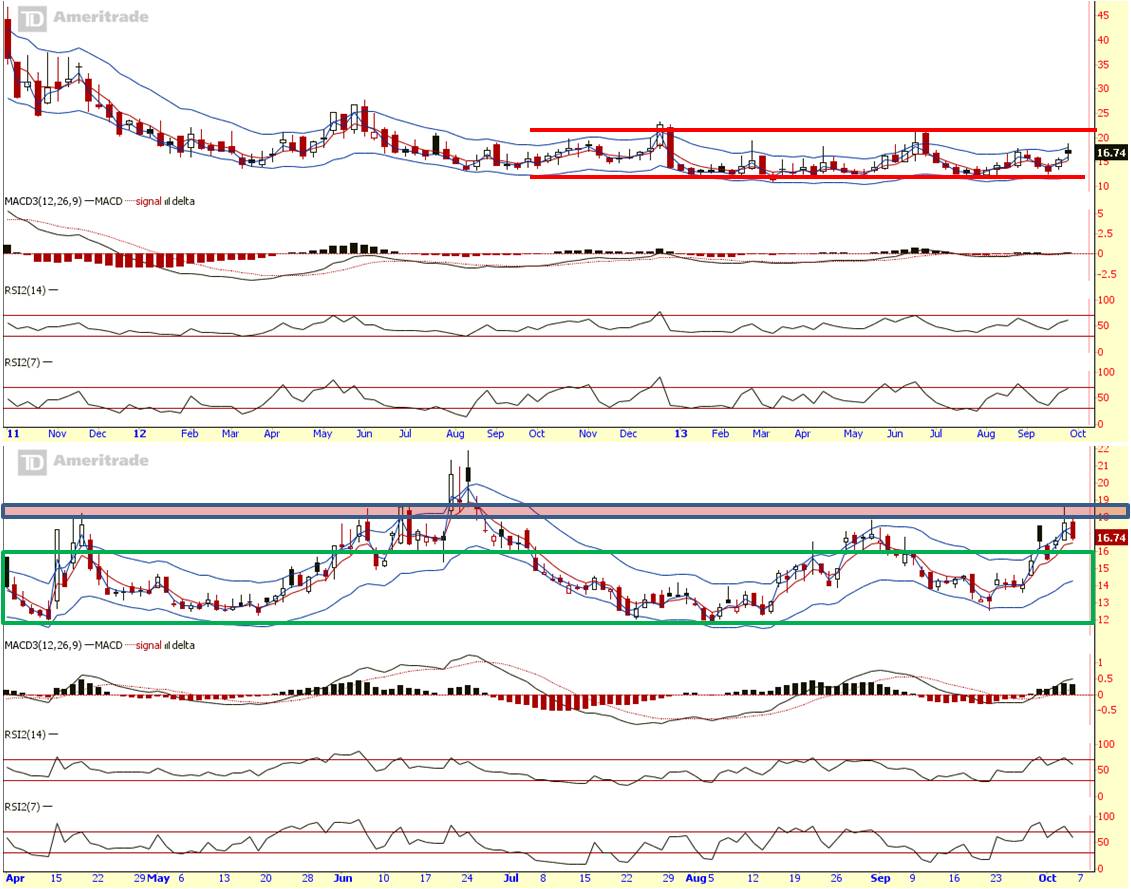
VIX (Fear index) weekly trend is still trending sideways, now sitting near the upper edge. VIX daily price hits extreme top of the resistance (marked as red horizontal bar), and pulls back.
Summary:
Mid term (weekly chart):
Trend is looking down.
Short term (daily chart):
Daily looking bullish and VIX looking bearish. Unless S&P support fails to hold, or i believe the rally would continues. If the rally is strong enough to break resistance level 1695, mid term trend would resume its upside outlook. If the rally is weak, needless to say, down trend continues.
Cheers
Strongerhead ways to becoming a better trader
NOTE: All information provided “as is” for informational purposes only, not intended for trading purposes or advice.
