The bulls did fight back, but in an ugly fashion on the first trading day of the week. When that happens, you must run to be safe than sorry. Bears firmly in control by Friday’s closing bell.
May monthly candle closed UP (Chart not shown). Long term view is still in bullish territory.
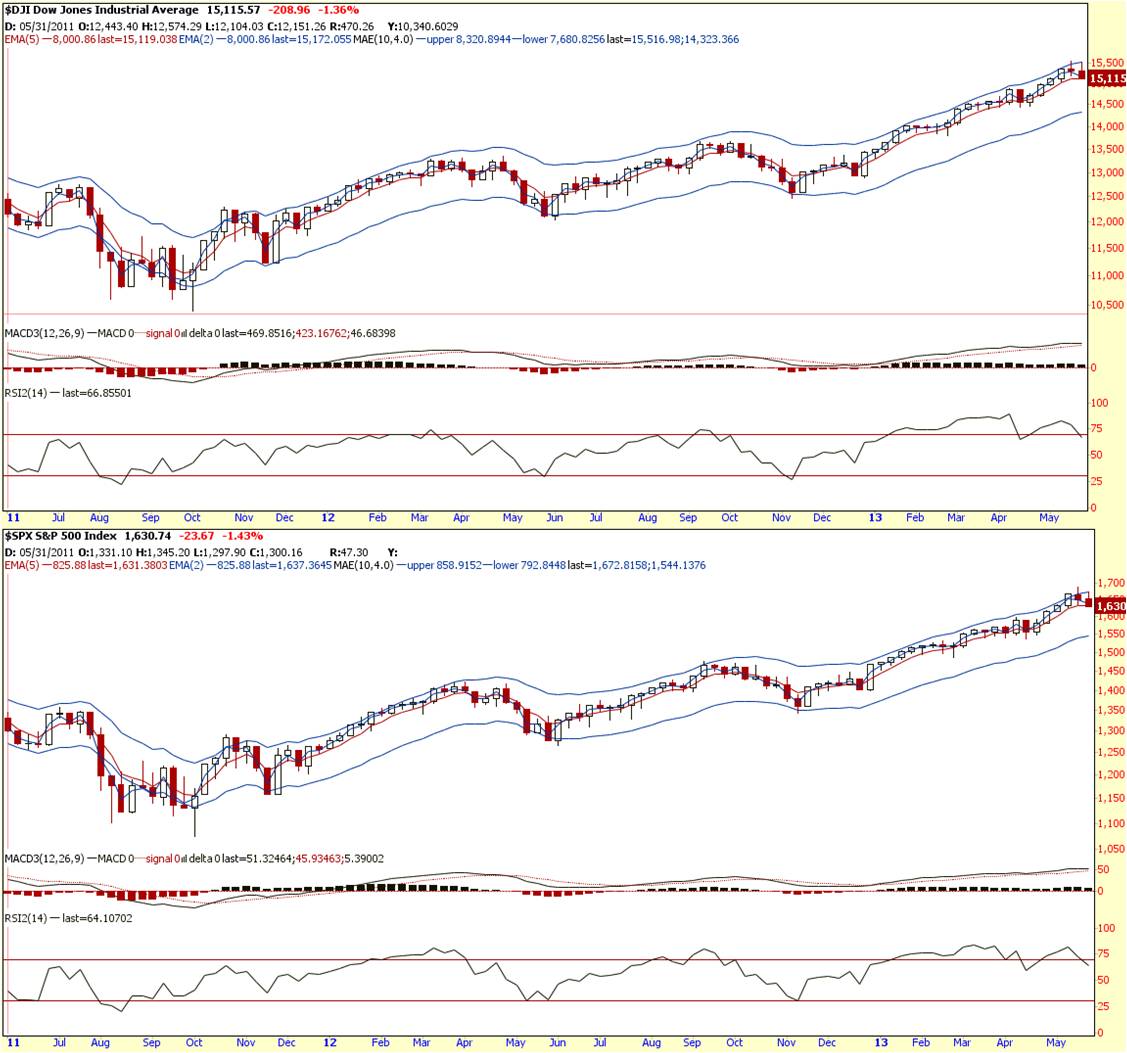
On the weekly, 2nd red candle has formed causing the EMA line to close in on each other. If it crossed, the benefit of the doubt favours the bears.
The price action failing to close higher after it reached its previous top created a false upside breakout. The next three trading days hammered the bulls. Dow in oversold zone based on RSI by Friday closing.
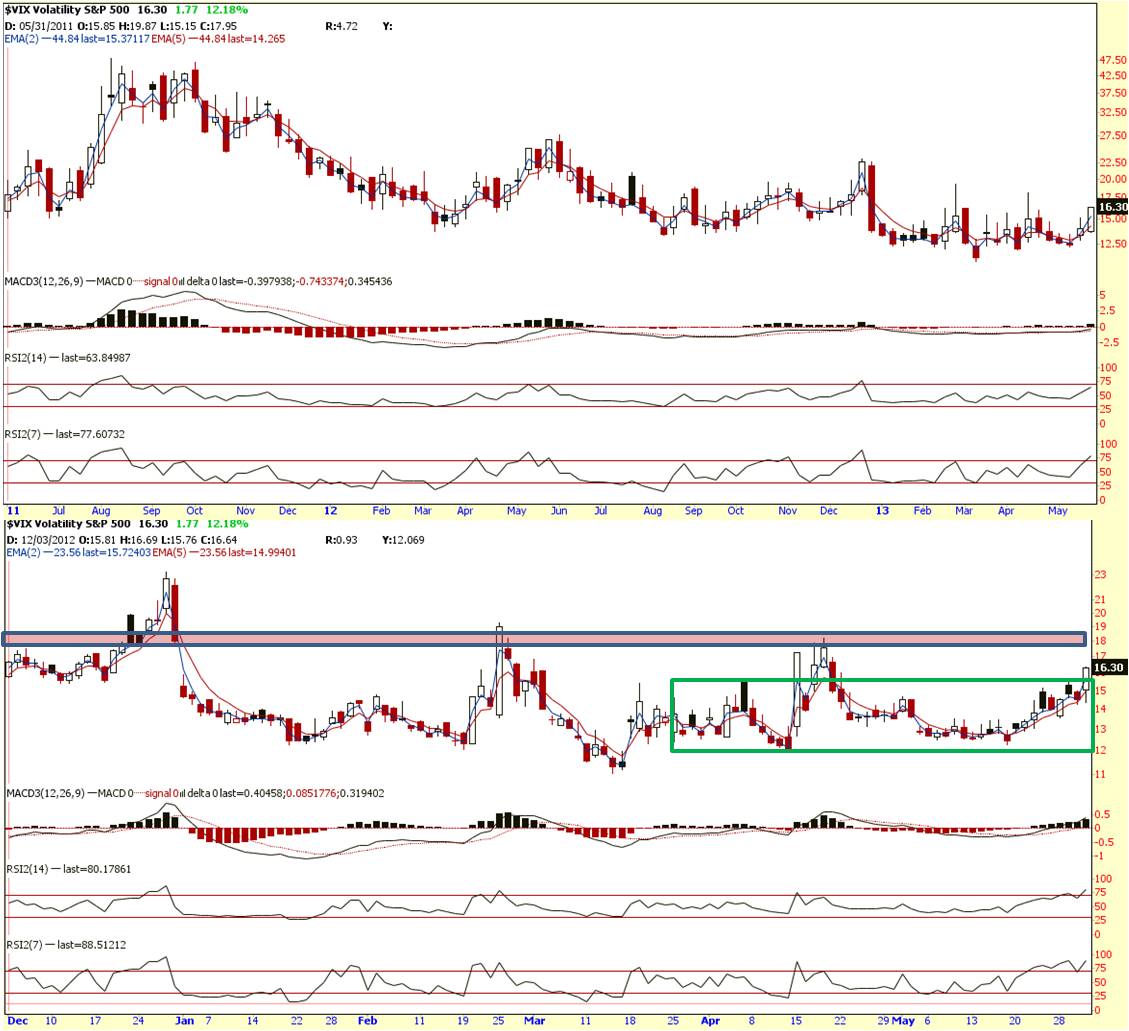
VIX (fear index) weekly RSI reaching overbought zone.
VIX daily price has broke out of the green box. RSI is in overbought zone. VIX daily RSI seldom stay overbought for long. But it doesn’t mean prices cannot go higher. However, when RSI reaches over heat zone, a pullback will usually follows before prices goes higher.
Summary:
Midterm view:
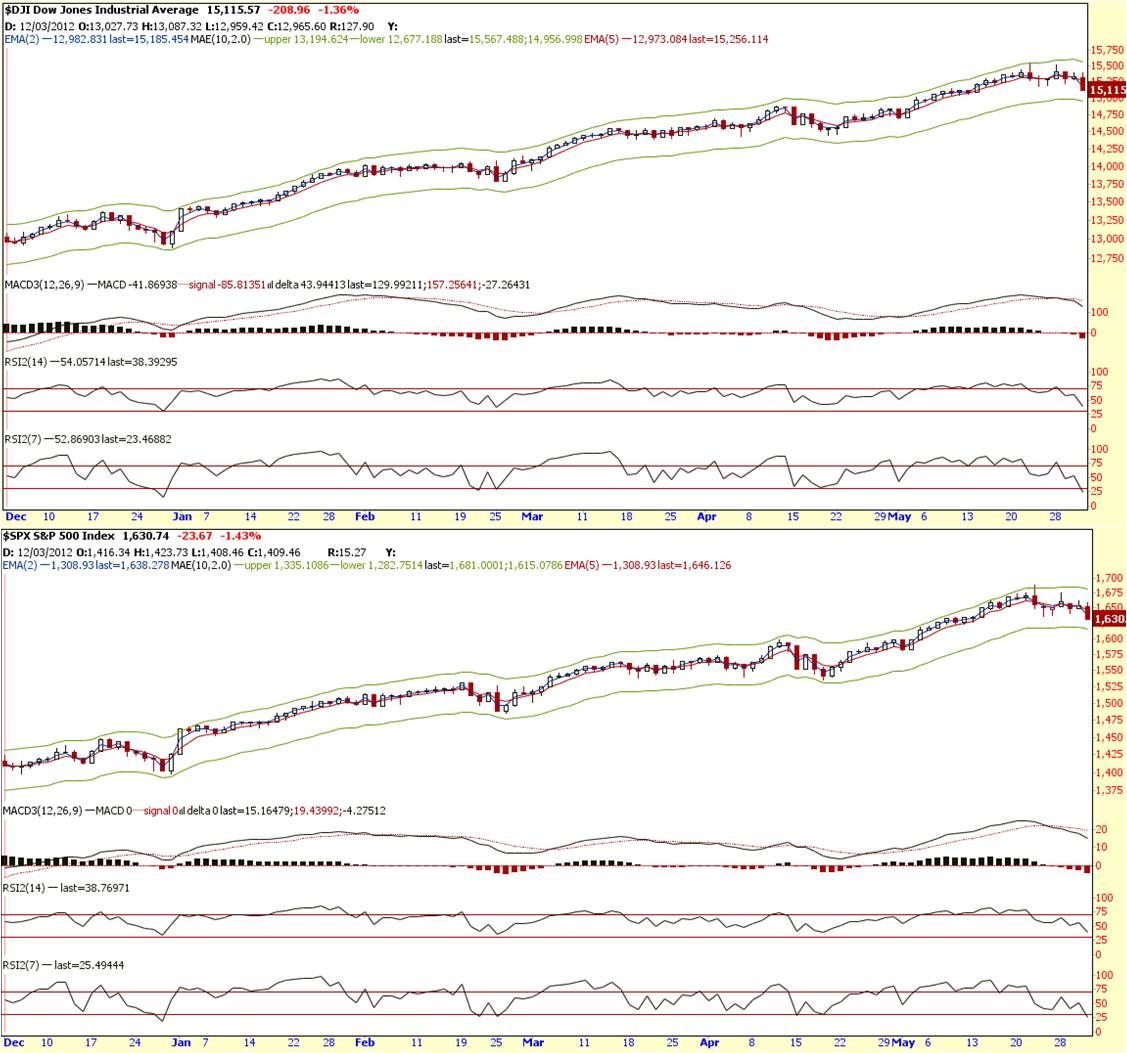
Trend is UP. EMA about to cross. If it crossed, change of sentiments confirmed in the midterm.
Short term view:
Trend is DOWN. VIX is in overbought zone, and Dow in oversold zone. Potential rally to happen in the coming week, especially if prices hits bottom of its price envelop. Shorting opportunity present itself if this happened. But if rally holds above 1650 on S&P, potential bull trap where you will have to cut lost and run.
Cheers
Strongerhead ways to becoming a better trader
NOTE: All information provided “as is” for informational purposes only, not intended for trading purposes or advice.
